

Abstract
Cosmetics consumers need to be aware of their skin type before purchasing products. Identifying skin types can be challenging, especially when they vary from oily to dry in different areas, with skin specialist providing more accurate results. In recent years, artificial intelligence and machine learning have been utilized across various fields, including medicine, to assist in identifying and predicting situations. This study developed a skin type classification model using a Convolutional Neural Networks (CNN) deep learning algorithms. The dataset consisted of normal, oily, and dry skin images, with 112 images for normal skin, 120 images for oily skin, and 97 images for dry skin. Image quality was enhanced using the Contrast Limited Adaptive Histogram Equalization (CLAHE) technique, with data augmentation by rotation applied to increase dataset variety, resulting in a total of 1,316 images. CNN architectures including MobileNet-V2, EfficientNet-V2, InceptionV2, and ResNet-V1 were optimized and evaluated. Findings showed that the EfficientNet-V2 architecture performed the best, achieving an accuracy of 91.55% with average loss of 22.74%. To further improve the model, hyperparameter tuning was conducted, resulting in an accuracy of 94.57% and a loss of 13.77%. The Model performance was validated using 10-fold cross-validation and tested on unseen data, achieving an accuracy of 89.70% with a loss of 21.68%.
Keywords: Image enhancement, Image augmentation, Data preparation, Skin images, Contrast limited adaptive histogram equalization (CLAHE), CNN
1. Introduction
Skin care is an essential component of a healthy lifestyle. During the past decade the average age of people using cosmetic skin care products has decreased, with higher demand among teenagers and working people. Skin care products promote a younger appearance, thereby boost confidence. Numerous manufacturers have responded to the rising demand for skin care products with many items available but skin type must be assessed before purchase. Skin specialists underline the necessity of understanding skin type before ordering products for direct dermal application. Some skin types can be identified by eyes, while the others cannot. Some people have a mixture of skin types, with oily and dry skin in different regions of the body. The skin care industry has mushroomed over the past two decades, with Artificial Intelligence (AI) and Machine Learning (ML) utilized in many areas including healthcare, medicine, agriculture, industry and personal care and cosmetics. Deep learning (DL) is a machine learning technique that teaches computers to learn by example, and its use is rapidly expanding as technology and device specifications improve. Deep learning has advanced technology to the next level to solve real-world problems such as skin cancer classification [1], [2], [3], [4], [5], [6].
Numerous studies have significant contributions to skin classification [7], [8], [9], [10], [11], [12], [13], [14], [15], [16], [17], [18]. Research in 2020 supported dermatologists by providing fundamental information on deep learning and CNN, demonstrating their applications in the classification of skin diseases [2] and emphasizing the potential of CNN-based methods in automated diagnosis, while acknowledging the need for further research and advancements in image processing and pattern recognition for improved performance. The paper focused on two key areas: disease classification from medical images (such as dermoscopy and pathological images) and disease classification from digital photographs. The main concepts of deep learning now are for helping the dermatologists to understand and adopt computerized methods based on CNNs to showcase the state-of-the-art applications for lesion classification from medical images and colored photographs while also discussing their limitations. The paper also highlighted the lack of desktop applications for dermatological diseases other than skin cancer and suggested potential area for future development.
Many skin researches state that skin diseases pose significant challenges in terms of accessibility to medical care due to various factors such as physical disabilities, physiological issues, distance, limited medical expertise in rural areas, climate conditions, and employment constraints. The time consuming and expensive nature of diagnosis further discourages individuals from seeking dermatological care. However, widely available user-friendly smartphone applications are now prevalent in many fields including medicine. In the domain of dermatology, these applications have gained particular importance. Most skin diseases are visually identifiable, with diagnosis relying on examination of lesions and pattern recognition. The research conducted by [3] addressed whether skin diseases can be automatically diagnosed by leveraging advancements in mobile technologies and deep learning-based methodologies. A review of recent smartphone applications was conducted to explore their potential for empowering patients to actively manage their health and provide an assessment of their capabilities. In 2021, researchers successfully demonstrated teledermatology multiclass skin lesion detection and classification using a CNN model that generated images with 16 layers, and enhanced contrast using High Dimensional Color Transform (HDCT). The schema returned an RGB image as output with high contrast. Transfer learning was then applied to a pre-trained DenseNet201 model. The researchers extracted the features and integrated them into Extreme Learning Machine (ELM) classifiers with multiple classes. Results demonstrated that a CNN model could be pre-trained by a problem-related model and used for feature extraction. The output of the proposed model outperformed the four popular datasets ISBI2016, ISIC2017, PH2 and ISBI2018.
Later, in [4], researchers proposed a cosmetic skin type classification as four main categories including normal, dry, oily and combination utilizing a CNN to categorize skin type based on cosmetic items with the same label. Their classification model accuracy was 85% with a slight preference for oily images.
The field of deep learning requires a powerful processing unit to compute large amount of data with image augmentation used to artificially expand a small dataset [19], [20], [21], [22]. In 2021, [19] suggested that image data augmentation improved deep learning-based model performance in pathological lung segmentation. The study used a variety of techniques by generating a random patch inside the lung and then blurring the area with a Gaussian filter. Contrast and brightness were then adjusted Experimental results revealed that this data augmentation strategy outperformed the standard approach in deep learning. Following these advancements, this research has three main objectives as follows, including:
-
•
To contribute to deep learning in the medical field by developing an image classification system for human skin types.
-
•
To provide a convenient alternative for dermatologists and patients who may lack time or resources for in-person consultations.
-
•
To combine deep learning with specialist knowledge, to effectively classify different human skin types, thereby reducing the burden on dermatologists.
This paper is organized as follows. Section 2 provides an overview of various techniques including image augmentation, image enhancement, and classification model construction. Section 3 presents the proposed methodology and outlines the overall approach. The experimental results in Section4 which showcase the outcomes obtained from the proposed stages, while Section 5 highlights the study drawbacks and limitations. Finally, Section 6, draws conclusions, summarizes the outputs derived from the proposed method, presents a comparative analysis of related research, and discusses future study areas.
2. Literature reviews
2.1. Human skin types
Human skin types differ [23], with each having its own unique characteristics and care needs. The three main skin types include normal, oily, and dry skin. Fig. 1 shows samples of image dataset for each type: (a) dry skin image, (b) normal skin image, and (c) oily skin image. Following describes the characteristic of each skin type.
Figure 1.

The three types of skin including (a) dry skin, (b) normal skin, and (c) oily skin.
- Dry skin lacks sufficient moisture, leading to tightness, roughness, and flakiness, often having a dull and dehydrated appearance. People with dry skin experience discomfort and increased sensitivity, sometimes leading to irritation. Dry skin can be influenced by various factors such as the environment, genetics, aging, and inadequate hydration. Regular moisturization is crucial to replenish moisture and maintain a healthy skin barrier, with severe dryness resulting in eczema or dermatitis.
- Normal skin is considered healthy and well-balanced. It has a smooth texture, good elasticity, and maintains a natural moisture balance. People with normal skin have few skin issues, as their skin is neither excessively oily nor dry. The skin looks clear, with medium-sized pores and an even tone, producing a healthy amount of sebum which keeps it moisturized without being too oily.
- Oily skin is characterized by an overproduction of sebum. The skin appears shiny or greasy, particularly in the T-zone (forehead, nose, and chin). Oily skin often has enlarged pores and is prone to acne, blackheads, and whiteheads due to excess oil clogging the pores. However, oily skin tends to age at a slower rate and has natural protection against fine lines and wrinkles.
2.2. Image acquisition and preparation
A DSLR Camera was used for capturing the human skin images. All images are face skin images taken under fluorescence light source. The original image files (640 × 480 pixels) were saved into JPEG format. It is the collection of a total of 60 subject's data. The subjects from the ages of 20 to 45 years old took part in our experiment. Image preparation increases the quality of the original image data used for training the computer vision models. Image enhancement and augmentation were performed during the preparation phases of skin datasets to improve the quality and increase data quantity to an acceptable level. Preparatory method techniques were compared for optimal model fit and performance. The model with the best score metrics was determined by combining data preparation using the original datasets, datasets with enhanced image quality, datasets with image augmentation to increase data, and labeling data into a Boolean array, as shown in Fig. 2.
Figure 2.
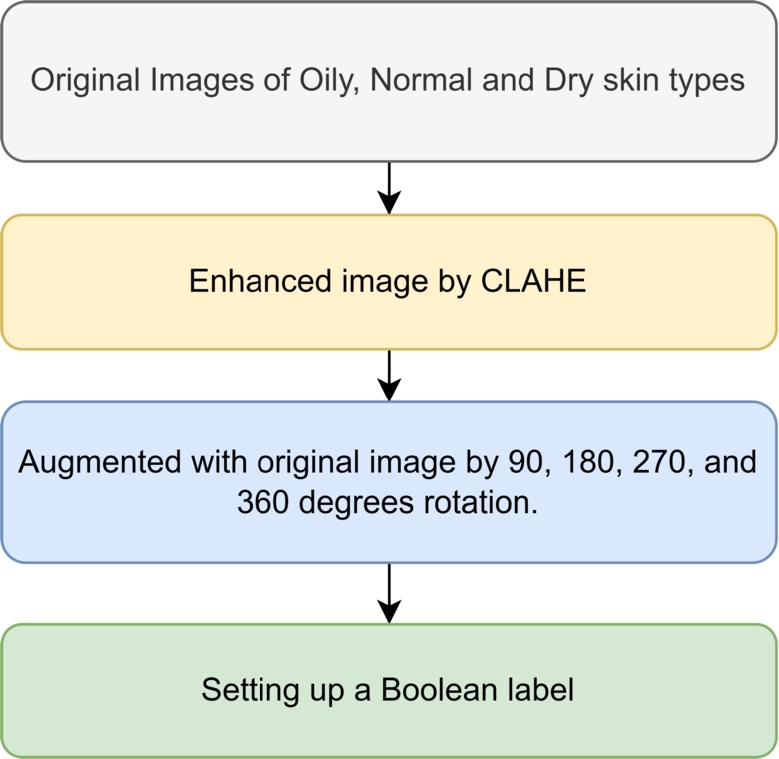
Overall process of data preparation.
2.2.1. Contrast limited adaptive histogram
Image enhancement is a modification process to ensure a more appropriate classification because some images may contain unclear features. Enhancing the image contrast improves skin texture, with marks more visible. CLAHE was used to enhance and increase image contrast depending on the near-constant image regions. CLAHE is a variation of adaptive histogram equalization (AHE) that is used to control excessive contrast amplification and compute multiple histograms each focusing on a specific region of the image to redistribute the luminance values [24]. By contrast, CLAHE is more complex to implement than regular adaptive methods. CLAHE was designed to avoid the problem of overamplification and is based on the algorithm shown in Fig. 3. When an image is received, the image is then split into 8x8 tiles (OpenCV's default size) and distortion correction is applied to each block. Then, the titles are checked to see if they exceed the contrast limit. If so, excess tiles are cut off and accumulated. The cumulative overrun is scaled and mapped to other blocks. Finally, a bilinear interpolation algorithm is applied to assemble all blocks into one image [25], [26].
Figure 3.
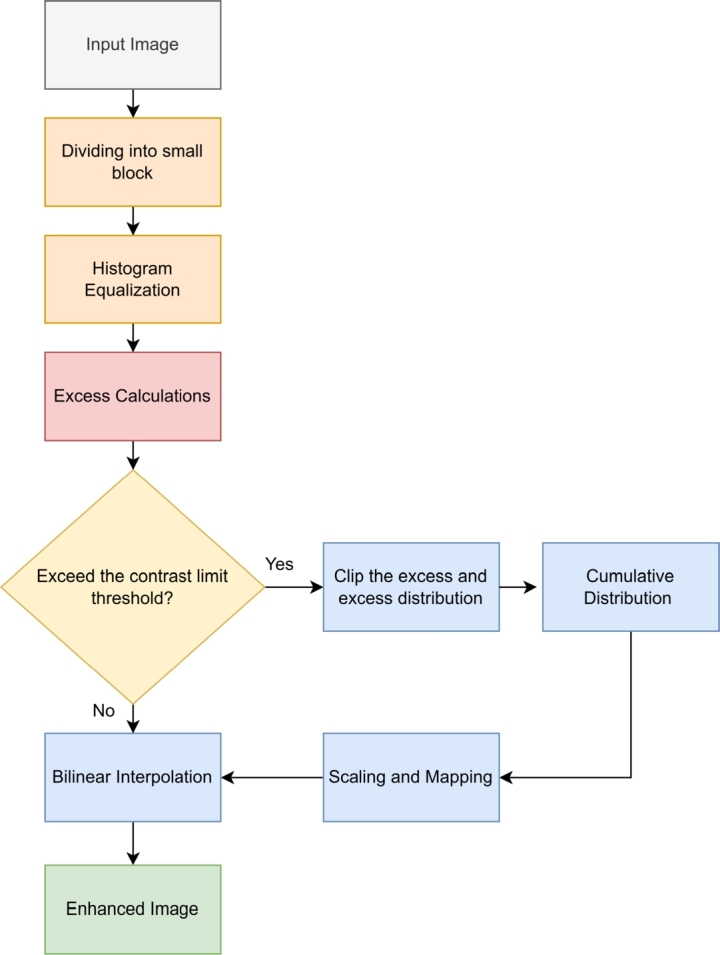
A CLAHE workflow diagram.
Fig. 4 shows a comparison between the original image and a new image created by CLAHE method. The main effect of CLAHE is that it increases the visibility of details and textures in areas with low contrast by stretching the intensity range of each tile, making both darker and lighter regions more distinguishable. This technique is particularly useful for enhancing images that have non-uniform illumination or low contrast, resulting in an image with improved clarity and better visual representation of fine details.
Figure 4.

Comparison between a) the original and b) enhanced image using CLAHE.
Noise is an important factor affecting the performance of automated classifications. To overcome this issue, many denoising methods have been used according to the type of noises [27]. The proposed method has achieved high performance without any extra noise reduction step, which usually leads to increased computational costs. Various normalization algorithms with different types of images have been used to obtain high performances [28], [29], however, they may increase computational costs. Therefore, we will not apply an extra intensity normalization step in our proposed approach to obtain efficient results.
2.2.2. Image augmentation by rotation
Computer vision data augmentation is an effective technique for enhancing the performance of computer vision models without collecting extra data. One typical data augmentation technique is random rotation. As illustrated in Fig. 5, the position of the original image was transformed by 90, 180, 270 and 360 degrees of clockwise rotation and the number of skin image was increased 4-fold to 1,316 images from 329 images.
Figure 5.
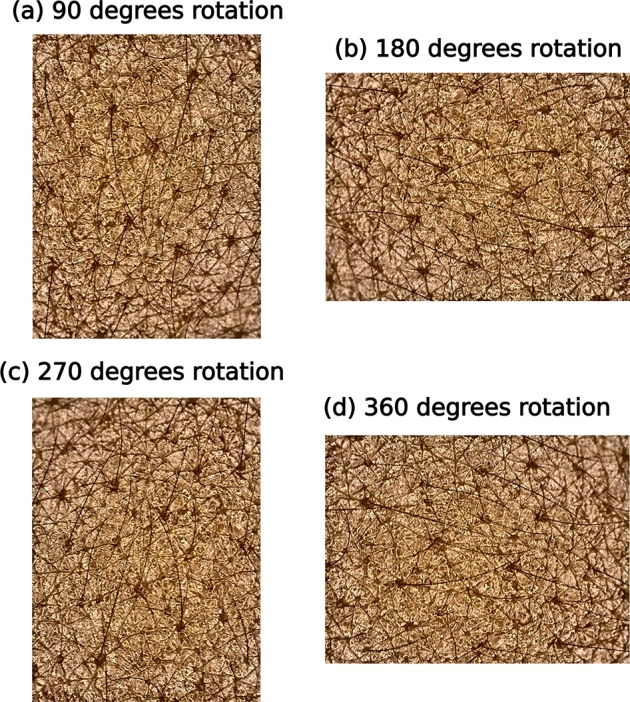
Examples of rotating images: (a) 90 degrees rotation, (b) 180 degrees rotation, (c) 270 degrees rotation, and (d) 360 degrees rotation.
2.2.3. Multi-label skin type data
The string-type labels were converted into a Boolean array, with false and true representing 0 and 1, respectively to classify the three skin types. Data in row and columns are presented as Boolean values. If the array labels at the first two positions are false, the data relate to oily skin.
2.3. Convolutional neural network for skin classification
Deep learning now complements artificial intelligence, with computers trained to perform classification tasks directly from images, text or voice. Machine learning is now used as a tool for sophisticated calculations.
A CNN is one of the most effective machine learning algorithms. Raw images can be fed into the model as the building blocks for model learning.
This study focused on the smallest model with the fastest training time. The four models MobileNet-V2, EfficientNetV2, Inception-V2 and ResNet are described below.
2.3.1. MobileNetV2
MobileNetV2 [30] is an innovative deep neural network architecture that specifically caters to the needs of efficient and lightweight image classification and feature extraction on mobile and embedded devices. Developed as an extension of the original MobileNet framework by Google, MobileNetV2 introduces a range of enhancements to improve performance and efficiency. Architecture of the MobileNet-V2 model is illustrated in Fig. 6.
Figure 6.

Architecture of the MobileNet-V2 model.
The cornerstone of MobileNetV2 lies in its utilization of depth-wise separable convolutions, which divide the traditional convolution operation into distinct depth-wise and point-wise convolutions. By decomposing the process, MobileNetV2 significantly reduces computational complexity and parameter count while maintaining a commendable level of accuracy. Depth-wise convolutions independently perform spatial filtering for each input channel, while point-wise convolutions consolidate the filtered outputs across channels.
One of the key advancements in MobileNetV2 is the introduction of inverted residual blocks that amplify the representation power of the network while simultaneously minimizing computational costs. Inverted residuals employ a bottleneck structure that compresses input feature maps using 1x1 convolutions, followed by a depth-wise convolution. Subsequently, the dimensions are expanded again using 1x1 convolutions. This bottleneck design drastically reduces computation while facilitating seamless information flow through the network.
2.3.2. EfficientNetV2
The EfficientNet-V2 model design is shown in Fig. 7, with an inverted residual block or MBConv Block, both of which contribute to compact size and rapid training times. A residual block is used in image models to solve efficiency issues, and this technique has been widely implemented in mobile CNN models. The 1x1 convolution in the inverted residual block minimizes the parameters, while 3x3 convolution layers use depth-wise convolution to conserve processing resources. Depth-wise convolution is a separate operation from the standard convolution, which typically transforms the feature by multiplying it repeatedly by some factor. This approach is commonly used in CNN models tuned for use on mobile devices. Once the feature has been extracted from the 3x3 convolution layer, another round of field restriction with the 1x1 convolution layer is required. The MBConv building block struggles to deal with huge feature images or large overall image sizes. To speed up the traditional MBConv procedure, the Fused Inverted Residual or Fused MBconv was introduced in [31] by combining the 1x1 Conv and 3x3 Conv into a single 3x3 Conv to accelerate the model to the next level.
Figure 7.

Architecture of the EfficientNet-V2 model [31].
2.3.3. InceptionV2
InceptionV2 [32], also known as GoogLeNet, is a deep CNN architecture introduced as an improvement over the original Inception network and developed by researchers at Google to address the challenges of training deeper networks while keeping computational requirements manageable. The key innovation in InceptionV2 is the introduction of the “Inception module” which is a stacked set of parallel convolutional layers of different sizes. Fig. 8 presents an architecture of the Inception-V2 model. In this model, the parallel layers perform different receptive field sizes and capture features at different scales, allowing the network to learn a diverse range of features. The Inception module replaces the traditional single-size convolutional layer and helps prevent information loss due to fixed filter sizes.
Figure 8.

Architecture of the Inception-V2 model.
2.3.4. ResNet-V1
ResNet [33] architectures typically consist of several stacked residual blocks. Each residual block contains a set of convolutional layers and shortcut connections. The convolutional layers within the block perform feature extraction and transformation, while the skip connections allow the network to propagate information from earlier layers directly to later layers. This facilitates the flow of gradients during training and enables the network to learn more efficiently. The architecture of the ResNet-V1 model is provided in Fig. 9. The key advantage of ResNet is its ability to train very deep networks by using residual connections, gradients can propagate more effectively through the network, alleviating the vanishing gradient problem and allowing successful training of deeper architectures. This enables the network to learn more complex and abstract features, leading to improved performance in tasks such as image classification, object detection, and image segmentation.
Figure 9.

Architecture of the ResNet-V1 model.
2.3.5. Feature extraction
A CNN with deep learning has two layers. In the initial convolutional layer, a procedure occurs where a filter travels over the picture receptive fields and checks features in the image. To ensure that every pixel in the image has been checked for features, the image is run through several filters. After applying a filter to an image, the distance between the input pixels and the filter is determined. This layer produces a feature map, also known as convolved features map as collection of dots. The second layer is a pooling layer, which repeats a filter loop across the image. To reduce data collection size, the number of input parameters can be reduced to ensure enhanced functionality of the CNN while reducing its complexity [34].
2.3.6. Training a neural network
Equation (1) presents the training in a neural network as follows:
| (1) |
where x contains the input features and to denote a neural network model. The model can be written as to input a prediction, with model parameters adjusted to reduce the loss function. The term θ denotes all the parameters, while describes the state of model prediction depending on the current state of the parameters. The goal of training a neural network is to minimize the loss function which describes the model failings. If y is the goal to achieve and is the prediction, the loss function can be denoted as . Machine learning trains models using the training set as the input x, with N as the number of examples. Neural networks use loops to minimize the loss function such as using gradient descent. If is the current state of the model, an improvement as the next state can be represented as with minimized loss function. The solution can be written as equation (1) with ▿ as the gradient to adjust parameter θ.
“The new parametersare equal to the old parametersminus the gradient concerning the old parameters of the error/loss of the neural network's prediction against the correct predictions averaged over the entire dataset and down-weighted by the learning rate.”[35]
2.4. Evaluation metrics
The classification result can be identified as positive or negative. Positive indicated a correct classification result while negative does not. A combination of positive and negative makes the prediction metric more detailed using precision, recall and F1-score to define the concepts of true positive (TP), true negative (TN), false positive (FP) and false negative (FN). Followings are the evaluation metrics used in this work.
| (2) |
| (3) |
| (4) |
| (5) |
- • Precision,
defined as Equation (2), measures how often accurate positive forecasts (true positives) are produced.
- • Recall,
defined as Equation (3), is a measure of how many of the positive samples in the data were correctly predicted by the classifier.
- • The F1-score,
defined as Equation (4), is a measure that combines recall and precision by calculating their harmonic mean. This average value is generally more suitable for ratios than the conventional arithmetic mean.
- • Accuracy,
defined as Equation (5), represents the proportion of correctly labeled subjects in comparison to the entire group of topics. It serves as a valuable metric for evaluating the overall correctness of a classification model.
2.4.1. Confusion matrix
A confusion matrix [36] is a table that summarizes the performance of a classification model. It provides a detailed breakdown of the predicted and actual classes for a set of instances. The matrix is organized into rows and columns, where each row represents the predicted class, and each column represents the actual class. The entries in the confusion matrix reflect the number of instances that fall into specific categories based on their predicted and actual class labels. A prediction matrix evaluates of the model accuracy and helps to identify the types of errors. The patterns within the matrix allow insights into the model's strengths and weaknesses. A confusion matrix is a fundamental tool for performance evaluation in classification tasks, serving as a basis for calculating various evaluation metrics such as accuracy, precision and recall to provide a more comprehensive understanding of the model's performance. A confusion matrix provides a clear visual representation of the classification results, allowing for a thorough analysis of the model's predictions and identifying areas for improvement.
2.4.2. Hyperparameter tuning
Hyperparameter tuning [37] refers to the process of selecting the optimal settings or configurations as the hyperparameters of a machine learning model. Hyperparameters are values that are set before the learning process begins and influences the behavior and performance of the model. Tuning these hyperparameters involves systematically exploring different combinations or ranges of values to find those that result in the best performance, such as accuracy or error rate. By fine-tuning the hyperparameters, we aim to enhance the model's ability to generalize and make accurate predictions on unseen data.
2.4.3. K-fold validation
K-fold cross-validation [38] is a commonly used technique in machine learning for evaluating the performance of a model. It involves dividing the dataset into k subsets, or folds, of equal size. The model is trained on k-1 folds and tested on the remaining fold. This process is repeated k times, with each fold being used once as the test set. The results are then averaged to give an overall performance measure of the model. K-fold cross-validation is used to assess the model's performance on new data and to prevent overfitting that occurs when a model is too complex and is fitted too closely to the training data, resulting in poor performance on new data. By using k-fold validation, the model is evaluated on multiple test sets, providing a more accurate estimate of its performance on unseen data.
2.4.4. Receiver operating characteristic (ROC) curve
The area under the Receiver Operating Characteristic curve [39], often referred to as AUC-ROC or simply AUC, is a popular evaluation metric used in binary classification tasks to measure the performance and discriminative power of a classification model. The ROC curve is a graphical plot that illustrates the trade-off between the true positive rate (sensitivity) and the false positive rate (1 - specificity) at various classification thresholds. The AUC-ROC quantifies the overall model performance by calculating the area under the curve. The AUC-ROC metric ranges between 0 and 1, with a value of 0.5 indicating that model performance is no better than random guessing, while a value of 1 indicates a perfect classifier with no false positives or false negatives. A higher AUC-ROC score indicates better model discriminative ability to distinguish between positive and negative instances, with higher probabilities assigned to positive than to negative instances. The AUC-ROC metric is particularly useful when dealing with imbalanced datasets or when the cost of false positives and false negatives is not equal. The AUC-ROC score provides a comprehensive evaluation of model performance across various classification thresholds, allowing the selection of an optimal threshold that balances true positives and false positives.
2.4.5. Gradient-weighted class activation mapping (GRAD-CAM)
GRAD-CAM [40] is a technique used in deep learning models to understand which parts of an input image contribute most to the predictions made by the model. GRAD-CAM helps to visualize and interpret the decision-making process by highlighting the image regions that strongly influence output values. GRAD-CAM achieves this by computing the gradients of the target class score with respect to the feature maps in the final convolutional layer. These gradients are then used to obtain a weighted combination of the feature maps, resulting in a heatmap that highlights the important areas of the image.
3. Methodology
The research protocols were authorized by the University of Phayao Human Ethic Committee, Thailand, approval number 3/019/58. The study was carried out on healthy volunteers who all have read and signed a written informed consent form.
The proposed approach involved four key steps and relied on deep learning to classify images of three different skin types, as shown in Fig. 10. Each step is explained below.
-
•
Step 1 Image Preparation: Three skin types were divided into segments as 80% for training, 10% for dataset validation and 10% for dataset testing and categorized according to the kind of skin image, as shown in Fig. 1, with 112 images for normal skin, 120 for oily skin and 97 for dry skin types. The three skin types in this dataset were determined by dermatologists.
-
•
Step 2: Image pre-processing approaches: This step focused on identifying the optimal preprocessing method that aligned with our human skin type dataset. The experiment involved applying various preprocessing techniques to each dataset. The implemented datasets were then evaluated to determine which yielded higher accuracy, with MobileNetV2 employed as the decision-making model.
-
•
Step 3: Model building: The datasets were used to test the transfer learning models MobileNet-V2, EfficientNet-V2, Inception-V2 and Resnet to determine which was the most effective at classifying human skin types.
-
•
Step 4: Model validation: The proposed model was then tested to determine more reliable result using several tools such as cross-check validation, test with unseen data to extract the ROC curve and visualize the output image by implementing GRAD-CAM.
Figure 10.

The proposed methodology.
4. Experimental results
In the first experiment, four datasets were compared to classify the skin model as the original dataset, the dataset with enhancement, the dataset with augmentation, and the dataset with both augmentation and enhancement. MobileNet-V2 was used as the classifier to retrieve the optimal quality results. The training model was tested with a data set that included enhancements made to 329 images using common local area heterogeneous enhancement methods. Image augmentation was conducted by rotating the original 329 skin images by 90, 180, 270, and 360 degrees to give 1,316 new images for use in this work. Finally, the images were enhanced to train the model. The data were divided as 80% for the training dataset, and 10% to validate the classification model, and 10% to test the model as an unseen data. As a result, the dataset changed, while all other parameters remained constant.
Based on the results depicted in Fig. 11, the CLAHE enhancement and image augmentation by rotating the image provided optimal performance and robustness. This data preparation technique yielded a model with increased accuracy while minimizing the loss metric. A non-enhanced and rotated strategy can achieve the same accuracy as enhanced rotation but precision is lost in the process. The loss function describes the accuracy of the model prediction method. The distance between the algorithm output and the expected result was calculated with a high loss, indicating major errors in the data. The experiment utilized identical pain scores, size and quantity of data. The model with the highest accuracy and lowest loss function gave the optimal performance.
Figure 11.

Accuracy and loss validation of the different datasets.
An imbalanced dataset was managed by adding rotating images to increase data quantity. The enhanced images also improved the algorithm extracted features, leading to more accurate outputs from the underlying learning model. Selecting the best model possible to maximize the learning process is essential.
Fig. 12 displays the confusion matrix for the validating phase. Findings demonstrated that the EfficientNet-V2 model had high level performance and reliability, with overall classification accuracy 91.55%. For normal skin, the model had the highest precision, 88.88% and recall 88.88%, whereas dry skin precision of 95.57% with highest recall 98.18%. For oily skin, precision was 89.28% and recall 86.20% because oily skins are difficult to define visually, making feature extraction harder.
Figure 12.
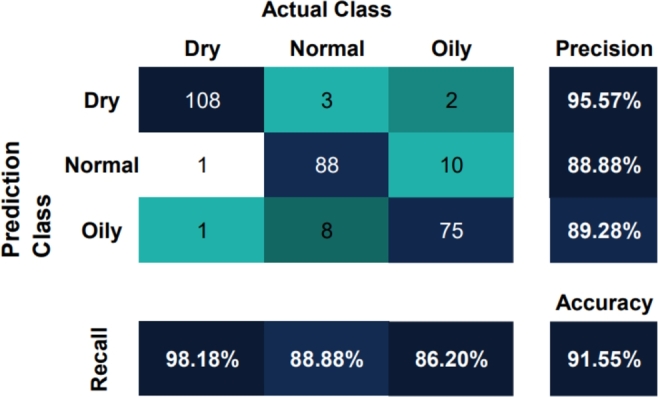
Confusion Matrix of the Prediction Model.
Table 1 presents the performance results of different models specific task. MobileNet-V2 achieved an accuracy of 89.52%, with comparable precision and recall scores around 89%. EfficientNet-V2 performed slightly better with an accuracy of 91.55% and similar precision and recall scores. Inception-V2 exhibited the highest accuracy among the models at 92.22%, with precision, recall, and F1-score around 92%, while ResNet-V1 had the lowest performance with an accuracy of 72.94% and lower precision, recall, and F1-score compared to the other models. The loss values indicate that EfficientNet-V2 had the lowest loss at 22.74%, while Inception-V2 had a slightly higher loss at 33.65%. Overall, results suggest that Inception-V2 performed the best in terms of accuracy and overall performance, while ResNet-V1 had the lowest performance among the evaluated models.
Table 1.
Experimental percentage results.
| Model | Accuracy | Precision | Recall | F1-score | Loss |
|---|---|---|---|---|---|
| MobileNet-V2 | 89.52 | 89.47 | 88.41 | 88.66 | 26.69 |
| EfficientNet-V2 | 91.55 | 91.24 | 91.09 | 91.15 | 22.74 |
| Inception-V2 | 92.22 | 92.27 | 92.08 | 92.16 | 33.65 |
| ResNet-V1 | 72.94 | 72.31 | 69.59 | 70.89 | 56.27 |
Results in Table 1 show that at 100 epochs with same data, InceptionV2 outputs the greatest accuracy but the loss was quite high. In part of EfficientNetV2, the output was outperformed in terms of accuracy and loss. The results were represented as classification matrix to validate loss and accuracy per epoch in each model.
Results also showed that the models gave the optimal classification for dry skin type because the characteristics of dry skin are easier to classify than the other types. Normal skin and oily skin, images look the same but had some characteristics and features that differed in computer vision. The EfficientNetV2 model outperformed the other three models in terms of accuracy and loss values, InceptionV2 gave the highest accuracy but also the highest loss metric, while the MobileNetV2 model had highest performance learning times.
4.1. Hyperparameter optimization results
The Hyperband algorithm [41], which is a random search, was used employed to optimize resources efficiency for each possible configuration. This algorithm is fast and uses time efficiently by optimizing random sampling to achieve the best results. Traditional optimization involves looping or randomizing all parameters which can take a long time. Therefore, the Hyperband only runs 1-2 iterations. If the outcome is not satisfactory, proceed to the following sets. If they achieve a decent outcome in one or two iterations, then run them for a longer period of time. This method was followed to achieve optimal results.
Table 2 displays the results of tuning hyperparameters during the training process. The best epoch achieved was 47, with a learning rate of 0.0001 and 512 dense units. This configuration yielded an accuracy of 94.59% and a loss of 17.99%. At epoch 43 with the same learning rate and a slightly lower number of dense units (416), the model achieved the same accuracy and a slightly lower loss of 17.78%. On epoch 42, the model with 512 dense units achieved a slightly higher accuracy of 94.93% but had a higher loss of 18.22%. At epoch 2, the model with 512 dense units achieved an accuracy of 94.25% and a lower loss of 17.48%. Lastly, at epoch 15 with a learning rate of 0.001 and 256 dense units, the model achieved an accuracy of 94.59% and a loss of 18.02%. These results demonstrate the impact of different hyperparameter settings on the model performance, showcasing the trade-offs between accuracy and loss that can be achieved by tuning these parameters.
Table 2.
Hyperparameter search optimization results.
| Best epoch | Learning rate | Dense units | Accuracy % | Loss % |
|---|---|---|---|---|
| 47 | 0.0001 | 512 | 94.59 | 17.99 |
| 43 | 0.0001 | 416 | 94.59 | 17.78 |
| 42 | 0.0001 | 512 | 94.93 | 18.22 |
| 2 | 0.0001 | 512 | 94.25 | 17.48 |
| 15 | 0.001 | 256 | 94.59 | 18.02 |
From the tuning results in Table 2, the second will be the best of 30 attempts, because the top one unfortunately makes no difference compares to the second but for the loss metrics is impressive noticeable. Therefore, the second one will be the best parameters for human skin type classification approaches. At the end of searching parameters, the improvement from un-tunning model and tuning model has a large of gap in terms of loss metrics by went from 0.2274 to 0.177808 as 24.48%. For the accuracy is also improved but not significantly by went from 0.9155 to 0.9457 as 3.29%.
Fig. 13 summarizes the performance of a classification model in a simple and concise way. For dry skin type, there were 54 correct predictions (true positives), 1 instance misclassified as normal skin (false negative), and 1 instance misclassified as oily skin (false negative). For normal skin type, there were 46 correct predictions (true positives), 8 instances misclassified as oily skin (false positive), and no instances misclassified as other types. For oily skin type, there were 37 correct predictions (true positives), 1 instance misclassified as dry skin (false negative), and 1 instance misclassified as normal skin (false positive).
Figure 13.
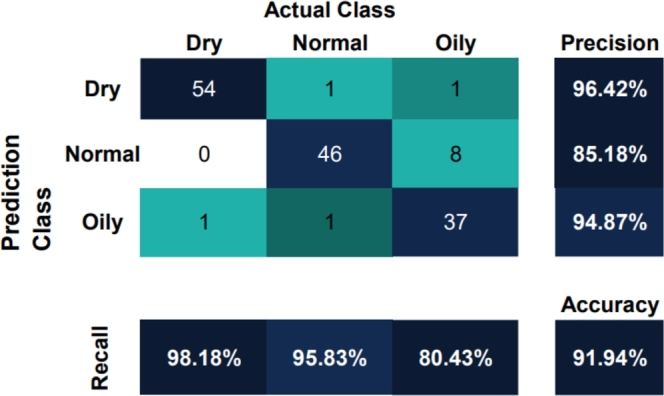
Confusion Matrix of the Tunned Model.
4.2. Model validation results
Results focused on the evaluation and assessment of the developed model using appropriate validation techniques and metrics.
4.2.1. K-fold cross-validation
K-fold cross-validation can identify model stability, dependability and reliability by running the cross-validation multiple times with different random searches or shuffling to observe variations in performance metrics.
The Results of k-fold cross-validation with 10 attempts and 100 epochs for each fold. The model exhibited average results, with an accuracy metric of 95.27% and a loss metric of 13.45%. Compared to previous experiments involving hyperparameter tuning, accuracy showed a marginal increase rising from 94.59% to 95.27%. Conversely, the loss metric underwent a substantial improvement, decreasing from 17.77% to 13.45%, marking a significant enhancement compared to the previous iteration (please see Table 3).
Table 3.
Accuracy and loss percentages per fold.
| Fold | Accuracy | Loss |
|---|---|---|
| 1 | 91.89 | 18.88 |
| 2 | 95.27 | 13.91 |
| 3 | 93.24 | 15.68 |
| 4 | 95.94 | 11.95 |
| 5 | 93.91 | 15.53 |
| 6 | 95.94 | 9.49 |
| 7 | 96.62 | 12.14 |
| 8 | 98.64 | 4.61 |
| 9 | 95.27 | 20.01 |
| 10 | 95.94 | 12.34 |
| Average | 95.27 | 13.45 |
4.2.2. Validate model with unseen data
Validation of a model using a test set guarantees a dependable and impartial evaluation, allowing well-informed decisions regarding its capability to generalize, suitability for deployment, and potential areas for improvement. By used the model that was highest performing among the 10 folds and using the test dataset which is the data that we split at first before any training, to ensure that the model will not unseen the dataset for accurate validation.
The model exhibited exceptional predictive capabilities specifically tailored to the classification of dry skin images. From a dataset consisting of 63 images of dry skin, the model accurately identified approximately 59 images as true positives. In 4 images, the model incorrectly classified dry skin as oily skin. For classification outcomes of normal, the model demonstrated a similar level of performance, correctly predicting 47 images as normal skin, with an erroneous prediction in 7 instances by incorrectly classifying images as oily skin (Fig. 14).
Figure 14.
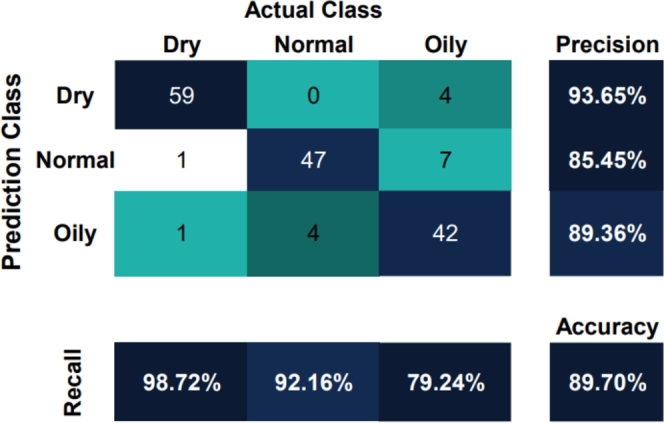
Confusion Matrix from Testing result.
From the classification metric, dry skin type was predicted with precision of 93.65% and recall of 98.72%, showing high accurate. For normal skin type, precision was 85.45% and the recall was 92.16% indicating highly accurate predictions. Oily skin type had precision of 89.36%, indicating accurate predictions, and a recall of 79.24%, suggesting that the model struggled to identify oily skin instances. Overall, the model achieved an accuracy of 89.70% and a loss of 21.68%. These classification metrics provided insights into model performance when classifying different skin types, with dry skin type showing the highest precision and recall values.
Overall, the model displays robust predictive abilities when classifying dry skin images, demonstrating remarkable accuracy. The model displayed a relatively consistent performance when classifying normal and oily skin, but made a few misclassifications, particularly when differentiating between oily skin and the other two skin types.
4.2.3. ROC curves
The model exhibited remarkable capabilities in classifying both oily skin and normal skin, showcasing nearly equal performance as indicated by the comparable area under the curve metrics. The AUC for oily skin was 0.89, while normal skin, reached 0.92. Despite the relatively smaller amount of available data for dry skin compared to the other two skin types, the model successfully leveraged the distinctive characteristics and features specific to dry skin, enabling accurate classification in this category that surpasses expectations, achieving the highest AUC metric of 0.98 across all skin types (Fig. 15).
Figure 15.

ROC curves from the validation model: (a) oily skin type vs. others, (b) normal skin type vs. others, and (c) dry skin type vs. others.
4.2.4. Comparison with baseline models
Comparison with the baseline was important to evaluate the effectiveness and superiority of the proposed model, and whether the performance was better or worse than the baseline in terms of validation, accuracy, and validation loss metrics. This comparison determined whether the proposed model offered any significant improvements over the baseline and was suitable for further development or deployment. Model comparison provided insights into the strengths and weaknesses of both models, enabling informed decisions about model selection and potential enhancements.
Table 4 presents validation accuracy and validation loss for EfficientNet-B7, EfficientNet-B5, EfficientNet-B4, EfficientNet-B3, EfficientNet-B2, EfficientNet-B0, and the proposed model. Validation accuracy represents the proportion of correctly classified instances, while validation loss measures the dissimilarity between the predicted and actual values, with lower values indicating better performance. Among the EfficientNet models, EfficientNet-B7 achieved an accuracy of 77.22% with a loss of 61.81%, followed by EfficientNet-B5 with an accuracy of 80.64% and a loss of 61.21%. The proposed model outperformed the EfficientNet models, achieving a higher validation accuracy of 89.70% with a lower validation loss of 21.68%. These results indicate that the proposed model demonstrated improved accuracy and reduced dissimilarity between predicted and actual values compared to the EfficientNet models.
Table 4.
Proposed model accuracy and loss percentages compared with the baseline model.
| Model | Accuracy | Loss |
|---|---|---|
| EfficientNet-B7 | 77.22 | 61.81 |
| EfficientNet-B5 | 80.64 | 61.21 |
| EfficientNet-B4 | 86.06 | 34.29 |
| EfficientNet-B3 | 86.08 | 35.15 |
| EfficientNet-B2 | 86.66 | 30.90 |
| EfficientNet-B0 | 86.66 | 28.25 |
| Proposed Model | 89.70 | 21.68 |
4.2.5. GRAD-CAM results
Results in Fig. 16 showed that the proposed model primarily focused on the center of the image, which contained numerous features such as skin marks, skin oiliness, and overall texture. The heatmap demonstrated red regions as the most crucial areas for analysis, while the blue regions were considered secondary.
Figure 16.

Visualization of GRAD-CAM Interpretation Stages. The figure displays the sequential stages of image interpretation using GRAD-CAM: (a) the original image, (b) the heatmap generated by GRAD-CAM, and (c) the output from the classification model.
5. Discussions
We presented in this paper a method for human skin type classification using image proecessing techniques with deep learning models. The strength of this work is that the performance of the proposed approach is highly acceptable and beneficial for commercial usage. The proposed method requires less computing resource which is feasible to be used in mobile application where dermatologists can cosmetologists can utilize this work in practice.
The proposed model showed promising results but it is important to acknowledge certain negative aspects related to bias and dataset imbalance. Despite extensive validations, the model consistently performed better in classifying dry skin compared to normal and oily skin. This performance discrepancy was attributed to biases inherent in the original datasets. The data collection process focused primarily on specific skin areas, which introduced challenges in feature extraction and classification for normal and oily skin types. These skin types share certain attributes, such as texture and the presence of acne, which further complicates the classification task. By contrast, the model demonstrated higher proficiency in classifying dry skin due to the dataset's emphasis on key attributes associated with dry skin, such as prominent skin marks. This uneven distribution of attributes within the dataset contributed to the differential performance of the model across three different skin types.
Imbalanced datasets present several drawbacks, leading to biased model performance that favors, the majority class, resulting in reduced accuracy for minority class predictions. Imbalanced datasets also limit the ability to generalize, making it less effective in handling unseen data. Underrepresentation of the minority class leads to misclassification and an increased number of false negatives or false positives. Evaluation metrics may be misleading, and training models become more challenging, requiring specialized techniques. To address these drawbacks, techniques like resampling, using appropriate evaluation metrics, and employing algorithmic approaches specifically designed for imbalanced datasets can help to improve model performance and mitigate the challenges posed by imbalanced data.
The data collection process is related to the limitations of CNNs which lack spatial understanding, with the inability to effectively capture long-range dependencies [42]. CNNs operate on fixed-size receptive fields and perform local operations. This limits their ability to understand spatial relationships between distant elements in an image or sequence and can be challenging for tasks that require global context such as understanding complex visual scenes or capturing long-term dependencies in sequential data. CNNs are also sensitive to variations in input scale, rotation, and translation which can affect their performance and may require additional techniques such as data augmentation or pre-processing. CNNs are used with high success rates in many computer vision tasks but their limited spatial understanding and inability to capture long-range dependencies are important considerations in certain applications.
A previous study [4] developed a model that classified oily, normal, dry, and combination skin types, with an accuracy of 85%. This accuracy was lower compared to our results but they were able to capture the entire facial area, which helped reduce biased classifications. In a future studies, it would be beneficial to compare the performance of our proposed method with a capsule-based network architecture. Capsule networks have been recently utilized for image classification and offer high potential to preserve spatial relationships of learned features [43], [44]. In terms of data collection, it would be advantageous to focus on capturing the entire face to prevent biased classifications towards any specific class.
6. Conclusions
Deep learning models developed in this work to classify human skin types (dry, normal, and oily) gave promising results. Some issues were initially encountered such as imbalanced and biased quality in certain datasets but these problems were successfully addressed. Image pre-processing techniques increased the amount of data to tackle the imbalance issue, With enhancement techniques employed to improve the quality of problematic datasets. There were still some biases in the image quality that limited model's performance but overall results remained acceptable.
The original dataset contained fewer samples for dry skin compared to the two other skin types but surprisingly, the model achieved the most promising results when classifying dry skin, suggesting that dry skin has distinct features that can be effectively captured, with normal, and oily skin sharing some attributes that the images may did not fully capture. Our proposed model met all the acceptable criteria.
During evaluation using new, unseen data, the model achieved an accuracy of 89.70%, correctly classifying most skin types. The model showed a loss of 21.68% indicating that it successfully captured relevant patterns and features to distinguish between different skin types. These findings suggested that the model had the potential to accurately predict skin types based on the given characteristics, thereby offering a valuable tool for skincare professionals and individuals seeking personalized skincare solutions.
Ethics statement
The research was approved by University of Phayao Human Ethic Committee, Thailand, approval number 3/019/58.
CRediT authorship contribution statement
Sirawit Saiwaeo: Formal analysis, Investigation, Methodology, Validation, Visualization, Writing – original draft, Writing – review & editing, Software. Sujitra Arwatchananukul: Formal analysis, Funding acquisition, Investigation, Methodology, Supervision, Validation, Writing – original draft, Writing – review & editing. Lapatrada Mungmai: Data curation, Investigation, Methodology, Writing – original draft, Writing – review & editing. Weeraya Preedalikit: Data curation, Investigation, Methodology, Writing – original draft, Writing – review & editing. Nattapol Aunsri: Conceptualization, Data curation, Formal analysis, Funding acquisition, Investigation, Methodology, Resources, Supervision, Validation, Writing – original draft, Writing – review & editing.
Declaration of Competing Interest
The authors declare that they have no known competing financial interests or personal relationships that could have appeared to influence the work reported in this paper.
Acknowledgements
The authors are grateful for the grant from Mae Fah Luang University under the National Science, Research, and Innovation Fund (NSRF), Thailand: in part by Mae Fah Luang University under the grant Fundamental Fund/Basic Research Fund, Thailand: 662A03013, and in part by Integrated AgriTech Ecosystem Research Group (IATE) at Mae Fah Luang University, Thailand. The authors would like to thank the School of Information Technology at Mae Fah Luang University for providing facilities to this work.
Biographies

Sirawit Saiwaeo received B.S. degree in Software Engineering from Mae Fah Luang University, Thailand in 2021. Currently working in 1Moby as an Software development associate and studying for the master's degree in computer engineering at Mae Fah Luang University, Thailand. His research interests include Artificial Intelligence, Machine Learning, and Image Processing.

Sujitra Arwatchananukul received the B.S. and M.S. degrees in Computer Science from Chiang Mai University, Thailand, in 2004 and 2008 respectively and Ph.D. degree in Computer Engineering from Yunnan University, China. In 2016, she joined the School of Information Technology, Mae Fah Luang University, as a lecturer. Her current research interests include Data Science, Machine Learning, Data Analysis, Image Processing, Software engineering, Algorithms and Database Management system.

Lapatrada Mungmai obtained a B.Sc. degree in Microbiology, M.S. degree in Biology and Ph.D. degree in Pharmacy from Chiang Mai University, Thailand in 2003, 2006 and 2013, respectively. Since January 2014, she has been working as an Assistant Professor of Cosmetic Sciences with the Department of Cosmetic Sciences at the Faculty of Pharmacy, University of Phayao, Thailand. Her research focuses on Industrial Microbiology, Cosmetic Innovation, Clinical studies, and the assessment of biological activity in natural products.

Weeraya Preedalikit obtained a B.Sc. Cosmetic Science from Mae Fah Luang University, Thailand, in 2010. In 2013, she earned a M.S. degree in Pharmaceutical Sciences from Chiang Mai University, Thailand. From January 2014 onwards, she has been working as an Assistant Professor of Cosmetic Sciences with the Department of Cosmetic Sciences, Faculty of Pharmacy, University of Phayao, Thailand. Her research focuses on plant extracts, their biological activities, the development of pharmaceutical formulations and natural products, and conducting clinical studies.

Nattapol Aunsri received the B.Eng. degree and M.Eng. degree in Electrical Engineering from Khon Kaen University and Chulalongkorn University, Thailand in 1999 and 2003, respectively. He obtained M.Sc. degree in Applied Mathematics and Ph.D. degree in Mathematical Sciences from New Jersey Institute of Technology, Newark, NJ, in 2008 and 2014, respectively. Since October 2021, he has been working as an Associate Professor of Computer Engineering with the School of Information Technology, Mae Fah Luang University, Chiang Rai, Thailand. He is with the Integrated AgriTech Ecosystem Research Group (IATE), and is also with the Computer and Communication Engineering for Capacity Building Research Center, both at Mae Fah Luang University. His research interests include ocean acoustics, Bayesian estimation and filtering, signal processing, biomedical signal processing, machine learning and AI applications, and mathematical and statistical modeling and analysis including computational finance and economic. Dr. Aunsri is a member of IEEE, APSIPA, ECTI, and IAENG.
Data availability
The authors do not have permission to share data.
References
- 1.Goceri E. 2021 44th International Conference on Telecommunications and Signal Processing (TSP) 2021. Automated skin cancer detection: where we are and the way to the future; pp. 48–51. [DOI] [Google Scholar]
- 2.Göçeri E. 2020 IEEE 4th International Conference on Image Processing, Applications and Systems (IPAS) 2020. Convolutional neural network based desktop applications to classify dermatological diseases; pp. 138–143. [DOI] [Google Scholar]
- 3.Göçeri E. 2020 Tenth International Conference on Image Processing Theory, Tools and Applications (IPTA) 2020. Impact of deep learning and smartphone technologies in dermatology: automated diagnosis; pp. 1–6. [DOI] [Google Scholar]
- 4.Kothari A., Shah D., Soni T., Dhage S. 2021 12th International Conference on Computing Communication and Networking Technologies (ICCCNT) 2021. Cosmetic skin type classification using CNN with product recommendation; pp. 1–6. [DOI] [Google Scholar]
- 5.Göçeri E. An application for automated diagnosis of facial dermatological diseases. İzmir Katip Çelebi Üniv. Sağlık Bilim. Fakült. Derg. 2021;6:91–99. [Google Scholar]
- 6.Dandu R., Murthy M.V., Kumar Y.R. Transfer learning for segmentation with hybrid classification to detect melanoma skin cancer. Heliyon. 2023;9 doi: 10.1016/j.heliyon.2023.e15416. [DOI] [PMC free article] [PubMed] [Google Scholar]
- 7.Kumar A.A., Krishna Reddy M.V., Sanjay V.M., Kothuru V., Shah K.P., Kalucha A. 2022 8th International Conference on Advanced Computing and Communication Systems (ICACCS), vol. 1. 2022. Comparative analysis of skin cancer prediction using neural networks and transfer learning; pp. 1518–1521. [DOI] [Google Scholar]
- 8.Shaik R., Bodhapati S.K., Uddandam A., Krupal L., Sengupta J. 2022 1st International Conference on the Paradigm Shifts in Communication, Embedded Systems, Machine Learning and Signal Processing (PCEMS) 2022. A deep learning model that diagnosis skin diseases and recommends medication; pp. 7–10. [DOI] [Google Scholar]
- 9.Xie P., Li T., Liu J., Li F., Zhou J., Zuo K. 2021 IEEE 3rd International Conference on Frontiers Technology of Information and Computer (ICFTIC) 2021. Analyze skin histopathology images using multiple deep learning methods; pp. 374–377. [DOI] [Google Scholar]
- 10.Shahin A.H., Kamal A., Elattar M.A. 2018 9th Cairo International Biomedical Engineering Conference (CIBEC) 2018. Deep ensemble learning for skin lesion classification from dermoscopic images; pp. 150–153. [DOI] [Google Scholar]
- 11.Polevaya T., Ravodin R., Filchenkov A. 2019 International Conference on Artificial Intelligence in Information and Communication (ICAIIC) 2019. Skin lesion primary morphology classification with end-to-end deep learning network; pp. 247–250. [DOI] [Google Scholar]
- 12.Yao P., Shen S., Xu M., Liu P., Zhang F., Xing J., Shao P., Kaffenberger B., Xu R.X. Single model deep learning on imbalanced small datasets for skin lesion classification. IEEE Trans. Med. Imaging. 2022;41:1242–1254. doi: 10.1109/TMI.2021.3136682. [DOI] [PubMed] [Google Scholar]
- 13.Vinod S., Thomas M.V. 2021 International Conference on Communication, Control and Information Sciences (ICCISc), vol. 1. 2021. A comparative analysis on deep learning techniques for skin cancer detection and skin lesion segmentation; pp. 1–6. [DOI] [Google Scholar]
- 14.Song L., Lin J., Wang Z.J., Wang H. An end-to-end multi-task deep learning framework for skin lesion analysis. IEEE J. Biomed. Health Inform. 2020;24:2912–2921. doi: 10.1109/JBHI.2020.2973614. [DOI] [PubMed] [Google Scholar]
- 15.Akay M., Du Y., Sershen C.L., Wu M., Chen T.Y., Assassi S., Mohan C., Akay Y.M. Deep learning classification of systemic sclerosis skin using the MobileNet-V2 model. IEEE Open J. Eng. Med. Biol. 2021;2:104–110. doi: 10.1109/OJEMB.2021.3066097. [DOI] [PMC free article] [PubMed] [Google Scholar]
- 16.Jiang Y., Dong J., Zhang Y., Cheng T., Lin X., Liang J. PFC-Net: position and context information fusion attention convolutional neural network for skin lesion segmentation. Heliyon. 2023;9 doi: 10.1016/j.heliyon.2023.e13942. [DOI] [PMC free article] [PubMed] [Google Scholar]
- 17.Zhang Z., Jiang Y., Qiao H., Wang M., Yan W., Chen J. SIL-Net: a semi-isotropic l-shaped network for dermoscopic image segmentation. Comput. Biol. Med. 2022;150 doi: 10.1016/j.compbiomed.2022.106146. [DOI] [PubMed] [Google Scholar]
- 18.Goceri E. 14th International Conference on Computer Graphics, Visualization, Computer Vision and Image Processing, 5th International Conference on Big Data Analytics, Data Mining and Computational Intelligence and 9th International Conference on Theory and Practice in Modern Computing. 2021. Comparative evaluations of CNN based networks for skin lesion classification. [Google Scholar]
- 19.Saiwaeo S., Mungmai L., Preedalikit W., Arwatchananukul S., Aunsri N. 2022 Joint International Conference on Digital Arts, Media and Technology with ECTI Northern Section Conference on Electrical, Electronics, Computer and Telecommunications Engineering. 2022. A comparative study of image enhancement methods for human skin image; pp. 484–488. [DOI] [Google Scholar]
- 20.Goceri E. Medical image data augmentation: techniques, comparisons and interpretations. Artif. Intell. Rev. 2023 doi: 10.1007/s10462-023-10453-z. [DOI] [PMC free article] [PubMed] [Google Scholar]
- 21.Goceri E. Comparison of the impacts of dermoscopy image augmentation methods on skin cancer classification and a new augmentation method with wavelet packets. Int. J. Imaging Syst. Technol. 2023 doi: 10.1002/ima.22890. [DOI] [Google Scholar]
- 22.Goceri E. 2020 IEEE 4th International Conference on Image Processing, Applications and Systems IPAS. IEEE; 2020. Image augmentation for deep learning based lesion classification from skin images. [DOI] [Google Scholar]
- 23.Baki G., Alexander K.S. Introduction to Cosmetic Formulation and Technology. John Wiley & Son, Inc.; 2015. CHAPTER 3. Skin care products; pp. 125–147. [Google Scholar]
- 24.Saenpaen J., Arwatchananukul S., Aunsri N. 2018 15th International Conference on Electrical Engineering/Electronics, Computer, Telecommunications and Information Technology (ECTI-CON) 2018. A comparison of image enhancement methods for lumbar spine X-ray image; pp. 798–801. [DOI] [Google Scholar]
- 25.Reza A.M. Realization of the contrast limited adaptive histogram equalization (CLAHE) for real-time image enhancement. J. VLSI Signal Process. Syst. Signal Image Video Technol. 2004;38:35–44. [Google Scholar]
- 26.Musa P., Rafi F., Lamsani M. A review: contrast-limited adaptive histogram equalization (CLAHE) methods to help the application of face recognition. https://doi.org/10.1109/IAC.2018.8780492 2018, pp. 1–6.
- 27.Goceri E. Evaluation of denoising techniques to remove speckle and Gaussian noise from dermoscopy images. Comput. Biol. Med. 2023;152 doi: 10.1016/j.compbiomed.2022.106474. https://www.sciencedirect.com/science/article/pii/S0010482522011829 [DOI] [PubMed] [Google Scholar]
- 28.Göçeri E. Proceedings of the International Conferences on Computer Graphics, Visualization, Computer Vision and Image Processing 2017 and Big Data Analytics, Data Mining and Computational Intelligence 2017 - Part of the Multi Conference on Computer Science and Information Systems 2017. 2017. Intensity normalization in brain MR images using spatially varying distribution matching; pp. 300–304. [DOI] [Google Scholar]
- 29.Goceri E. Fully automated and adaptive intensity normalization using statistical features for brain MR images. Celal Bayar Üniv. Fen Bilim. Derg. 2018;14:125–134. doi: 10.18466/cbayarfbe.384729. [DOI] [Google Scholar]
- 30.Sandler M., Howard A., Zhu M., Zhmoginov A., Chen L.-C. Proceedings of the IEEE Conference on Computer Vision and Pattern Recognition. IEEE; 2018. MobileNet-V2: inverted residuals and linear bottlenecks; pp. 4510–4520. [Google Scholar]
- 31.Tan M., Le Q.V. EfficientNetV2: smaller models and faster training. 2021. https://arxiv.org/abs/2104.00298https://doi.org/10.48550/ARXIV.2104.00298
- 32.Ioffe S., Szegedy C. Proceedings of the 32nd International Conference on Machine Learning. PMLR; 2015. Batch normalization: accelerating deep network training by reducing internal covariate shift; pp. 448–456. [Google Scholar]
- 33.He K., Zhang X., Ren S., Sun J. Proceedings of the IEEE Conference on Computer Vision and Pattern Recognition. IEEE; 2016. Deep residual learning for image recognition; pp. 770–778. [Google Scholar]
- 34.Raff E. O'REILLY MEDIA; 2021. CHAPTER 3. Convolutional Neural Networks; pp. 82–92. [Google Scholar]
- 35.Raff E. O'REILLY MEDIA; 2021. CHAPTER 2. Fully Connected Networks; pp. 31–34. [Google Scholar]
- 36.Galar M., Fernandez A., Barrenechea E., Bustince H., Herrera F. A review on ensembles for the class imbalance problem: bagging-, boosting-, and hybrid-based approaches. IEEE Trans. Syst. Man Cybern., Part C, Appl. Rev. 2012;42:463–484. doi: 10.1109/tsmcc.2011.2161285. [DOI] [Google Scholar]
- 37.Bergstra J., Bengio Y. Random search for hyper-parameter optimization. J. Mach. Learn. Res. 2012;13:281–305. http://www.jmlr.org/papers/v13/bergstra12a.html [Google Scholar]
- 38.Hastie T., Tibshirani R., Friedman J. second edition. Springer; New York: 2009. The Elements of Statistical Learning: Data Mining, Inference, and Prediction.https://books.google.co.th/books?id=tVIjmNS3Ob8C (Springer Series in Statistics). [Google Scholar]
- 39.Fawcett T. An introduction to ROC analysis. Pattern Recognit. Lett. 2006;27:861–874. doi: 10.1016/j.patrec.2005.10.010. https://www.sciencedirect.com/science/article/pii/S016786550500303X ROC Analysis in Pattern Recognition. [DOI] [Google Scholar]
- 40.Selvaraju R.R., Cogswell M., Das A., Vedantam R., Parikh D., Batra D. Proceedings of the IEEE International Conference on Computer Vision. IEEE; 2017. Grad-cam: visual explanations from deep networks via gradient-based localization; pp. 618–626. [Google Scholar]
- 41.Li L., Jamieson K., DeSalvo G., Rostamizadeh A., Talwalkar A. Hyperband: a novel bandit-based approach to hyperparameter optimization. J. Mach. Learn. Res. 2017;18:6765–6816. [Google Scholar]
- 42.Goceri E. International Conferences Computer Graphics, Visualization, Computer Vision and Image Processing 2021, Connected Smart Cities 2021 and Big Data Analytics, Data Mining and Computational Intelligence 2021. 2021. Analysis of capsule networks for image classification. [Google Scholar]
- 43.Goceri E. Classification of skin cancer using adjustable and fully convolutional capsule layers. Biomed. Signal Process. Control. 2023;85 doi: 10.1016/j.bspc.2023.104949. https://www.sciencedirect.com/science/article/pii/S1746809423003828 [DOI] [Google Scholar]
- 44.Goceri E. Proceedings of the 15th International Conference on Computer Graphics, Visualization, Computer Vision and Image Processing (CGVCVIP 2021), the 7th International Conference on Connected Smart Cities (CSC 2021) and 6th International Conference on Big Data Analytics, Data Mining and Computational Intel. 2021. Capsule neural networks in classification of skin lesions. [Google Scholar]
Associated Data
This section collects any data citations, data availability statements, or supplementary materials included in this article.
Data Availability Statement
The authors do not have permission to share data.