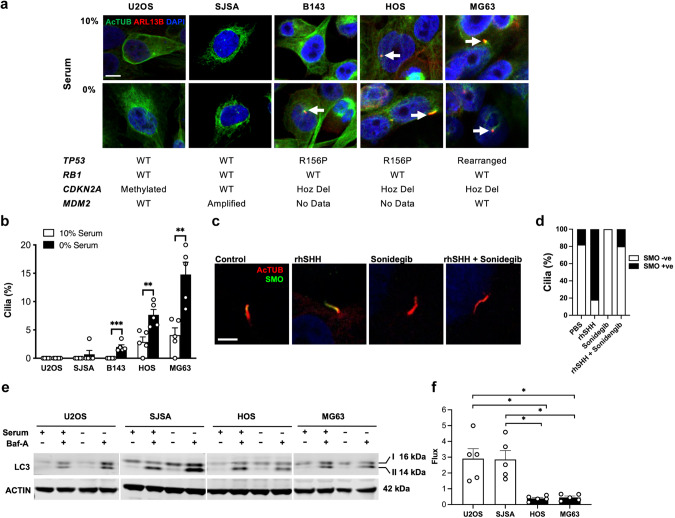
Fig. 5. Primary cilia formation and autophagic flux in human osteosarcoma in vitro.
a Immunofluorescence colocalization of acetylated α-tubulin (AcTUB) and ARL13B in human osteosarcoma cell lines cultured in 10% serum or serum-free media for 24 h. Representative images are shown, along with corresponding genotypes for each cell line. Scale bar = 5 µm. b Quantification of primary cilia frequency in human osteosarcoma cell lines cultured in 10% serum or serum-free media for 24 h. n = 5 individual experiments, mean + SEM, **P < 0.01, ***P < 0.001, Student’s unpaired t test. c Confocal immunofluorescence images of primary cilia stained for AcTUB and SMO in B143 human osteosarcoma cells treated with PBS, SHH (rhSHH) and/or sonidegib (LDE225). Scale bar = 5 µm. d Quantification of primary cilia co-expressing SMO in B143 human osteosarcoma cells treated with treated with PBS, SHH (rhSHH) and/or sonidegib, n = 11–14 ciliated cells per treatement. e Western blot analysis of LC3 and ACTIN expression in non-ciliated (U2OS) and ciliated (MG63) human osteosarcoma cell lines cultured in 10% serum or serum-free with or without 50 nM bafilomycin-A (Baf-A) for 24 h. n = 5 individual cell lines. f Quantification of autophagic flux by western blot in non-ciliated (U2OS) and ciliated (MG63) human osteosarcoma cell lines as shown in (e). n = 5 independent experiments, mean ± SEM. Graph represents fold change in autophagic flux in serum-free media (induced autophagy) compared to normal serum (basal autophagy) *P < 0.05, Student’s unpaired t test.

