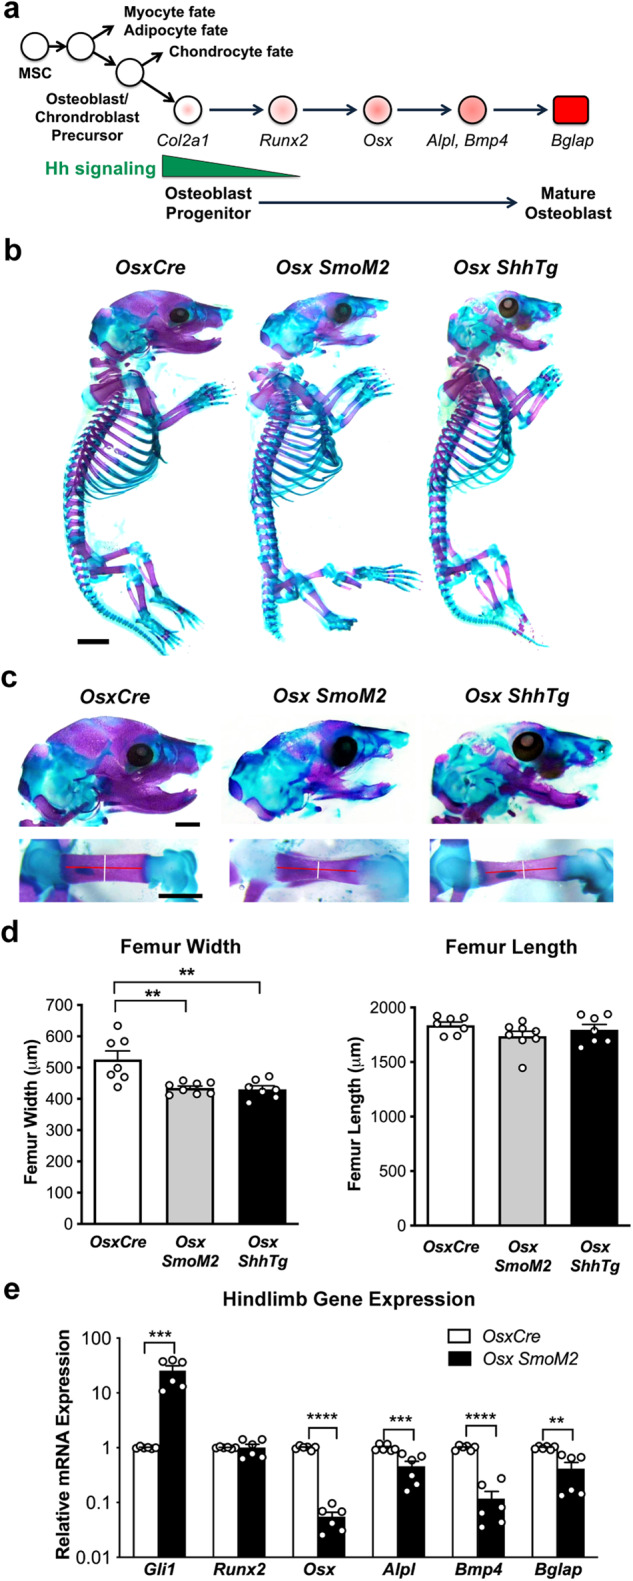
Fig. 6. Activation of Hedgehog during mouse osteoblast development.

a Schematic depicting osteoblast differentiation annotated with expression of relevant genes [27]. b Wholemount skeletal preparations stained with Alizarin Red (purple) and Alcian Blue (blue) of E18.5 OsxCre, Osx SmoM2, and Osx ShhTg embryos. Scale bar = 2 mm. c High magnification images of skull (top) and femur (bottom) from wholemount skeletal preparations of E18.5 OsxCre, Osx SmoM2, and Osx ShhTg embryos. Scale bar = 2 mm. Lines in femur images indicates measurement axis for width (white) and length (red). d Quantification of femur width (left) and length (right) from wholemount skeletal preparations. n = 7 independent embryos per genotype, mean ± SEM, **P < 0.01, one-way ANOVA/Tukey’s correction. e Gli1, Runx2, Osx1, Alpl, Bmp4 and Bglap mRNA expression in OsxCre, and OsxCre SmoM2 E18.5 hindlimbs. n = 6 independent embryos per genotype. All data are represented as mean + SEM, ** P < 0.01, *** P < 0.001, **** P < 0.0001, one-way ANOVA/Tukey’s correction.
