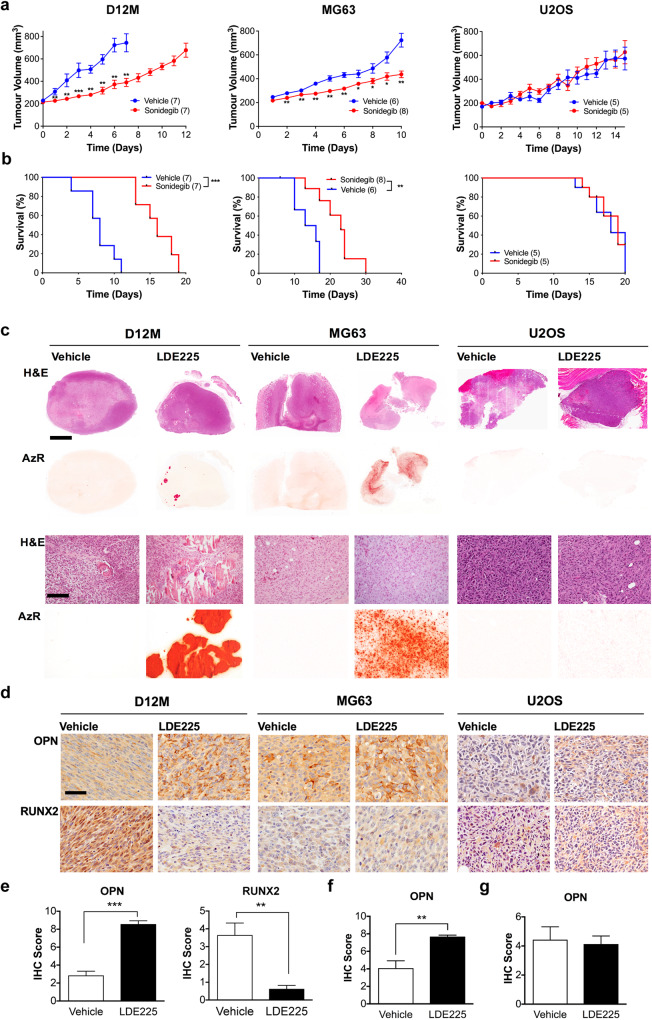
Fig. 7. Effect of Smoothened inhibition on human and mouse osteosarcoma growth and differentiation in vivo.
a Tumor volume of p53Rb KO mouse osteosarcoma allografts (D12M) and human osteosarcoma xenografts (MG63, U2OS) treated with vehicle control or 20 mg/kg sonidegib. All data are represented as mean ± SEM of biological replicates. *P < 0.05, **P < 0.01, ***P < 0.001, Mann–Whitney test. b Kaplan–Meier analysis of survival. **P < 0.01, ***P < 0.001, Log-rank (Mantel-Cox) test. c Hematoxylin and eosin, and alizarin red (AzR) staining of p53Rb KO mouse osteosarcoma allografts (D12M) and human osteosarcoma xenografts (MG63, U2OS) treated with vehicle control or 20 mg/kg sonidegib (LDE225). Scale bar = 2 mm (upper panels, scale bar = 200 µm (lower panels). d Osteopontin (OPN) and RUNX2 expression detected by immunohistochemistry in Osx p53Rb KO mouse osteosarcoma allografts (D12M) and human osteosarcoma xenografts (MG63, U2OS) treated with vehicle control or 20 mg/kg sonidegib (LDE225). Immunoperoxidase signal is shown in brown, counterstained with hematoxylin. Representative images are shown. Scale bar = 200 µm. e Quantification of OPN and RUNX2 immunohistochemistry in Osx p53Rb KO (D12M) allograft tumors. n = 4 independent animals. All data are represented as mean ± SEM of biological replicates. **P < 0.005; ***P < 0.001, Student’s unpaired t test. f Quantification of OPN immunohistochemistry in MG63 xenograft tumors. n = 4 independent animals. Data are represented as mean ± SEM, **P < 0.005, Student’s unpaired t test. g Quantification of OPN immunohistochemistry in U2OS xenograft tumors. n = 4 independent animals. Data are represented as mean ± SEM.

