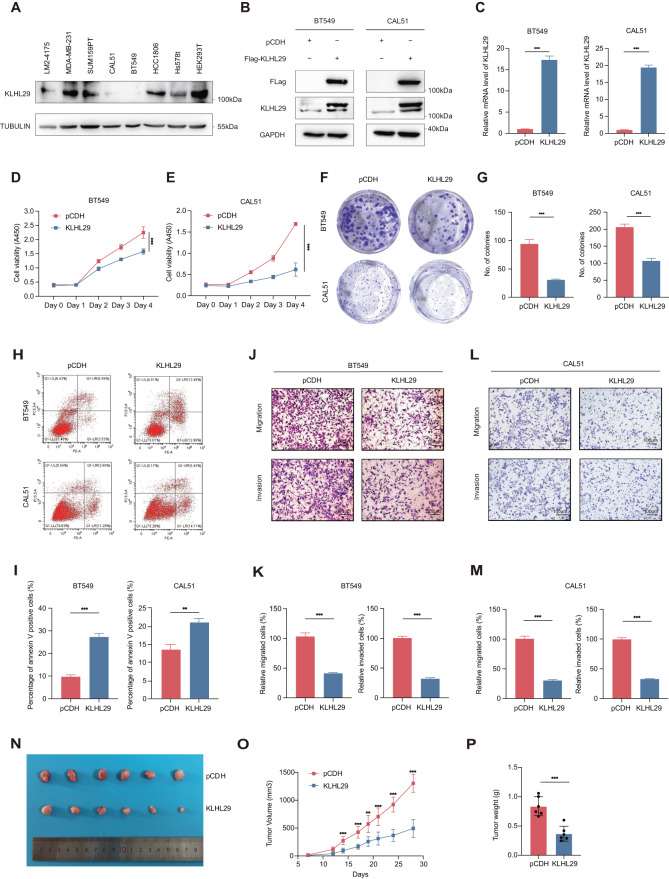
Fig. 2. KLHL29 inhibits TNBC proliferation, migration, and invasion.
A Western blotting analysis of endogenous protein levels of KLHL29 in TNBC cell lines and HEK293T. B, C KLHL29 expression was confirmed in BT549 and CAL51 cells stably expressing the empty vector pCDH-Flag and pCDH-Flag-KLHL29 by western blotting (B) and RT-qPCR (C) analyses. D, E Ectopic expression of KLHL29 suppresses cell proliferation of BT549 (D) and CAL51 (E) cells by cell viability assays using the Cell Counting Kit-8. F, G Ectopic expression of KLHL29 impedes colony-forming ability of BT549 and CAL51 cells by colony formation assays. Representative images of the colonies (F) and corresponding quantitative results (G) are shown. H, I Ectopic expression of KLHL29 augments cell apoptosis of BT549 and CAL51 cells by flow cytometry analysis. Representative images of cell apoptosis (H), and percentage of annexin V positive cells (I) are shown. J–M Ectopic expression of KLHL29 impairs cell migration and invasion of BT549 and CAL51 cells by cell migration and invasion assays using transwell chambers coated without and with Matrigel, respectively. Representative images of migrated and invaded cells (J and L), and corresponding quantitative results (K and M) are shown. N–P Ectopic expression of KLHL29 suppresses the growth of MDA-MB-231 cell-derived xenograft tumors. MDA-MB-231 cells stably expressing pCDH-Flag and pCDH-Flag-KLHL29 were injected orthotopically into mammary fat pad of NOD/SCID female nude mice (n = 6 mice per group). Representative tumor images (N), tumor growth rate (O), and tumor weight (P) are shown. **p < 0.01; ***p < 0.001 by two-tailed Student’s t test or two-way ANOVA test.

