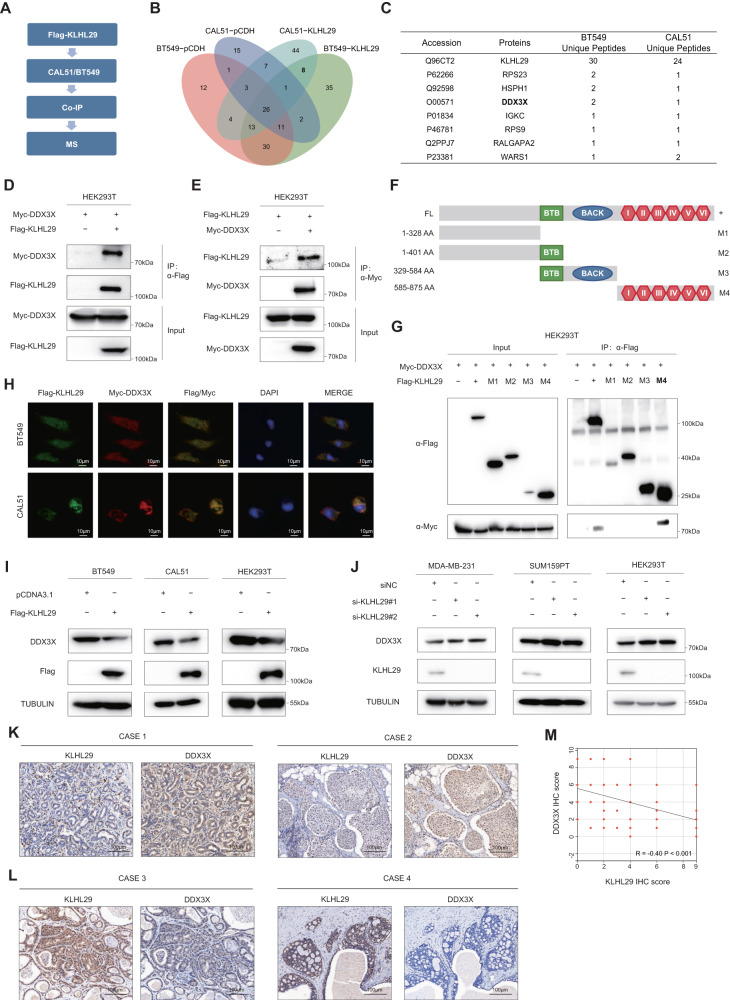
Fig. 4. KLHL29 interacts with DDX3X and inhibits protein levels of DDX3X in TNBC.
A The flow chart for identification of KLHL29-interacting proteins. BT549 and CAL51 cells stably expressing pCDH-Flag or pCDH-Flag-KLHL29 were subjected to IP assays, followed by MS analysis. B The Venn diagram analysis of KLHL29-interacting proteins. 46 proteins interact with KLHL29 in BT549 cells, and 69 proteins interact with KLHL29 in CAL51 cells. C The list of eight potential KLHL29-interacting proteins in both BT549 and CAL51 cells. D, E Exogenous KLHL29 interacts with exogenous DDX3X. HEK293T cells were transfected with plasmids encoding Flag-KLHL29 and Myc-DDX3X. Whole-cell lysates were immunoprecipitated with an anti-Flag or anti-Myc antibody and subjected to western blotting analysis with indicated antibodies. F Schematic diagram of the different KLHL29 truncation constructs used. G DDX3X interacts with the Kelch domain of KLHL29. HEK293T cells were transfected with the plasmids encoding the Flag-KLHL29 fragments along with the Myc-DDX3X plasmid, followed by a set of co-IP and western blotting assays. H Immunofluorescent images show the co-localization of Flag-KLHL29 (green) and Myc-DDX3X (red) in BT549 and CAL51 cells. The nuclear was counterstained with DAPI (blue). I Overexpression of KLHL29 reduces DDX3X protein levels in BT549 (left), CAL51 (middle) and HEK293T (right) cells. J Knockdown of KLHL29 elevates DDX3X protein levels in MDA-MB-231 (left), SUM159PT (middle) and HEK293T (right) cells. K, L Immunohistochemical staining analysis of KLHL29 and DDX3X expression in TNBC specimens. Representative images are shown. M Negative correlation between KLHL29 and DDX3X expression levels in TNBC specimens. Correlation coefficients were performed using the Spearman test. Two-tailed P-values were calculated.

