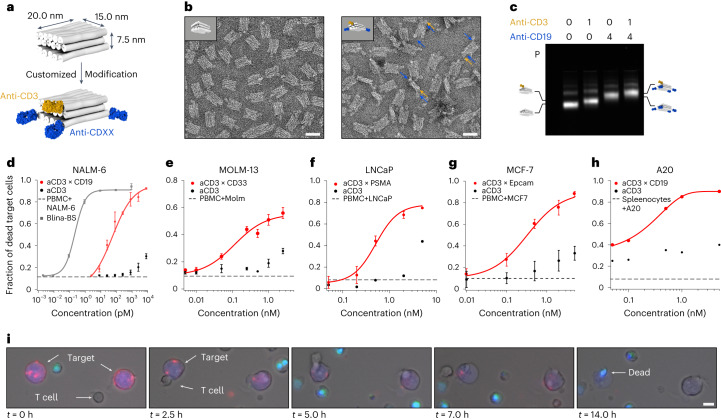
Fig. 2. Programmable T-cell-mediated killing of target cells.
a, Schematic of a multispecific brick-shaped antibody carrier (chassis) with dimensions of 10.0 × 15.0 × 7.5 nm3. The grey cylinders represent DNA double helices, and the F(ab) fragments are coloured in orange (anti-CD3) and blue (representing a F(ab) fragment for antigens located on the target cells). b, Negatively stained TEM image of the small chassis (left) and negatively stained TEM image of the small chassis with 1× anti-CD3 and 2× anti-CD19 F(ab) fragments (right). Scale bar, 25 nm. The arrows in blue and yellow highlight the attached F(ab) fragments as an example. c, Laser-scanned image of an agarose gel on which different samples were electrophoresed. The samples were prepared with different F(ab) fragment combinations (as indicated by the numbers). P, pocket; icons highlight the different antibody chassis variants; 0-0, reference for the migration of platform only. d–h, Cytotoxic T-cell-mediated target cell lysis assays. Fraction of dead target cells after 24 h as a function of PTE concentration in the assay (Supplementary Information). Effector (PBMC) and target cell ratio was chosen as 5:1. Red dots, multispecific T-cell-engaging variant with anti-CD3 and at least two target-specific F(ab) fragments for the respective cell line. Black dots, monospecific controls. Solid lines, Hill fit to the data. Dashed line, PBMC and target cells without PTE after 24 h. Grey squares, blinatumomab-biosimiliar (Blina-BS). The error bars to the data are standard deviations to the mean of three biological replicates. i, Live-cell fluorescence microscopy over 24 h of a mixture containing A20 cells (stained with CellTrace CSFE; blue) and splenocytes in a 1:5 ratio, and a variant (1× mu anti-CD3–4× mu anti-CD19) carrying a fluorescent tag (cyanine-5). A live–dead stain was used for the visualization of dead cells (SYTOX Orange; cyan). Scale bar, 2.5 µm.

