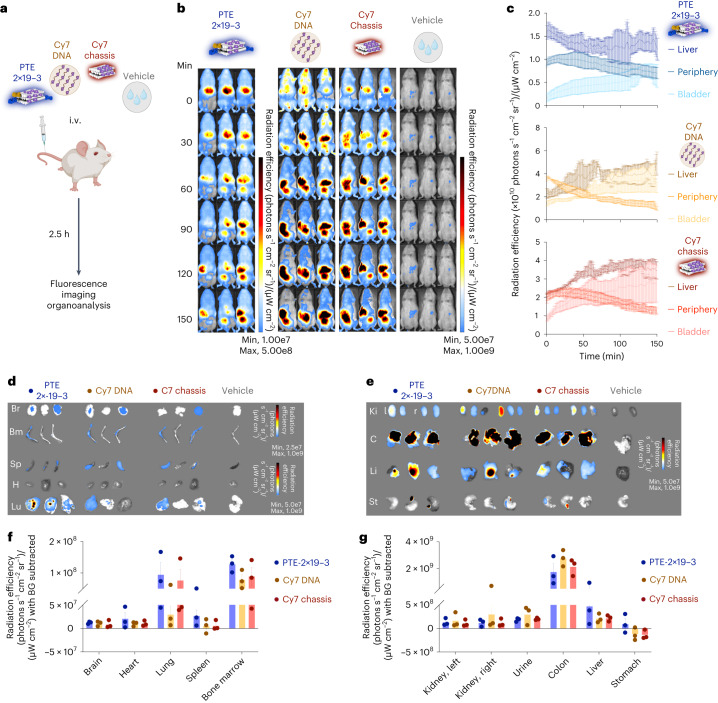
Fig. 3. In vivo characterization of DNA-origami-based T-cell engager.
a, Schematic of the experimental procedure. NSG mice were administered the highlighted samples carrying a Cy7 dye via a tail-vein injection. Distribution of the administered sample was then continuously measured using an in vivo imaging platform (IVIS). Colour scheme, bispecific PTE with Cy7 (midnight; PTE-2×19-3), DNA oligo with Cy7 (mocha; Cy7 DNA), DNA origami chassis with Cy7 (dark red; Cy7 chassis) and vehicle (grey; PBS). b, IVIS fluorescent images of NSG mice over time. Left to right, samples as indicated in a. c, Fluorescence intensity of the bispecific (bluish), Cy7 DNA (brownish) and Cy7 chassis (reddish) samples as a function of time across different organs/regions. Data are mean ± standard error of mean (s.e.m.) from three independent measurements of n = 3 mice. d,e, IVIS fluorescence images of different organs and excreta extracted from n = 3 NSG mice. f,g, Fluorescence intensity in different organs and excreta. The background fluorescence of each organ was subtracted. Data are mean ± s.e.m. from n = 3 mice.

