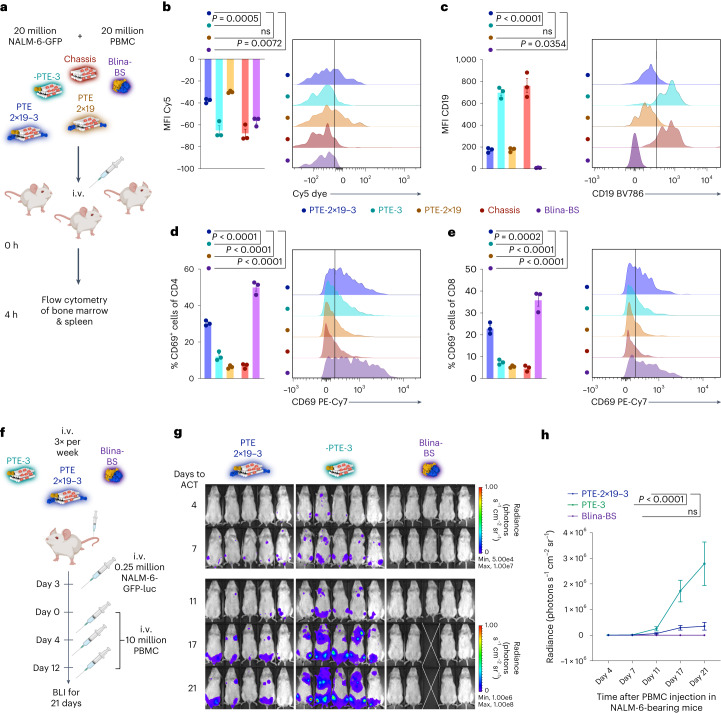
Fig. 4. Investigation of functionality of DNA-origami-based T-cell engagers in vivo.
a, Treatment schedule of binding and activation trials. Experimental procedure to measure the in vivo binding and activation behaviour on tumour (NALM-6) and T cells. Colour scheme: midnight blue, PTE-2×19-3; teal, PTE-3; mocha, PTE-2×19; red, chassis; violet, Blina-BS. Doses were between 10 and 15 pmol. NALM-6-GFP-luc, PBMC and samples were intravenously administered at the indicated time points. Three mice were injected per group. After 4 h, the mice were sacrificed and sample distribution in the bone marrow was analysed using flow cytometry. b,c, Mean fluorescence intensity (MFI) measurements (left) and representative histograms (right) of flow cytometric measurements of Cy5 fluorescence (b) or CD19-BV785 fluorescence (c) on NALM-6-GFP-luc cells (indicating Cy5-labelled PTE bound to the tumour cells). d,e, Measurement of CD69 fluorescence on either CD4+ (d) or CD8+ (e) T cells. In b–e, data are mean ± s.e.m. from n = 3 mice. f, Schematic of the long-term treatment with PTEs in vivo. g, Luminescence images of mice injected with luciferin to visualize NALM-6-GFP-luc tumour cells. The white cross indicates the mouse that was censored due to non-tumour-related toxicities. h, Quantification of bioluminescence measurements. For g and h, n = 5 mice per group; for h, mean ± s.e.m. is shown. For all the panels, statistical significance was calculated using ordinary one-way or two-way analysis of variance with Tukey’s multiple comparisons correction.

