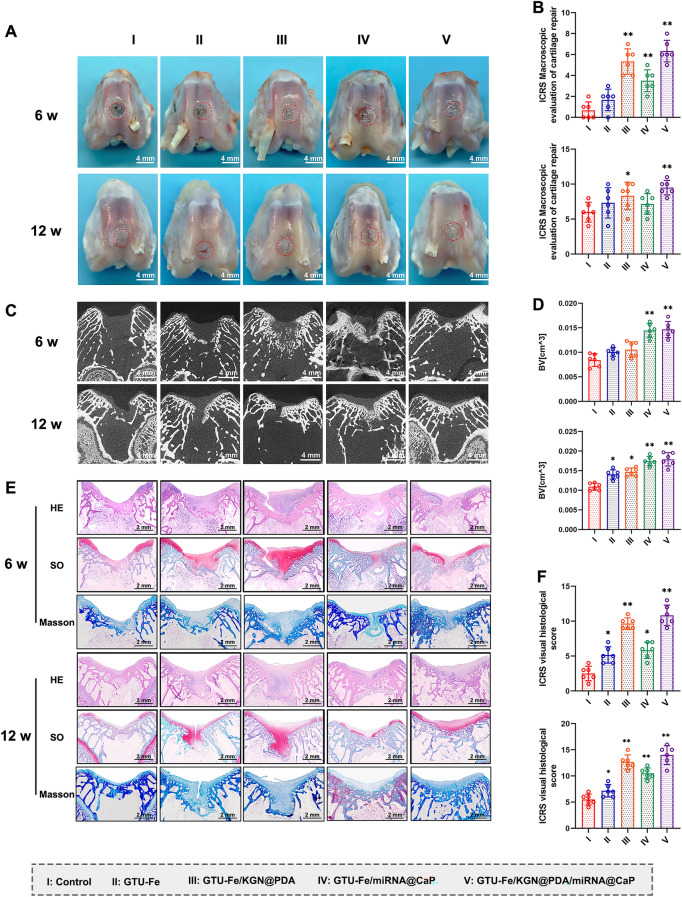
Fig. 6.
Macroscopic assessment of in vivo repair effect. A Gross morphology of formed tissues treated with different engineered implants after 6 and 12 weeks. Scale bar = 4 mm. B ICRS macroscopic scores of articular cartilage for the different groups. C Representative micro-CT coronal plane images and D quantitative analysis of bone regeneration in the regenerative osteochondral defects (BV, the bone volume). Scale bar = 4 mm. E Representative images of H&E, Safranine O (SO) and Masson staining of the cartilage defects at 6 and 12 weeks post-surgery. Scale bar = 2 mm. F ICRS visual histological scores of repaired cartilage of the different groups. The p-value was calculated by one-way ANOVA test (*p < 0.05 and **p < 0.01). Data are represented as mean ± SD (n = 6)

