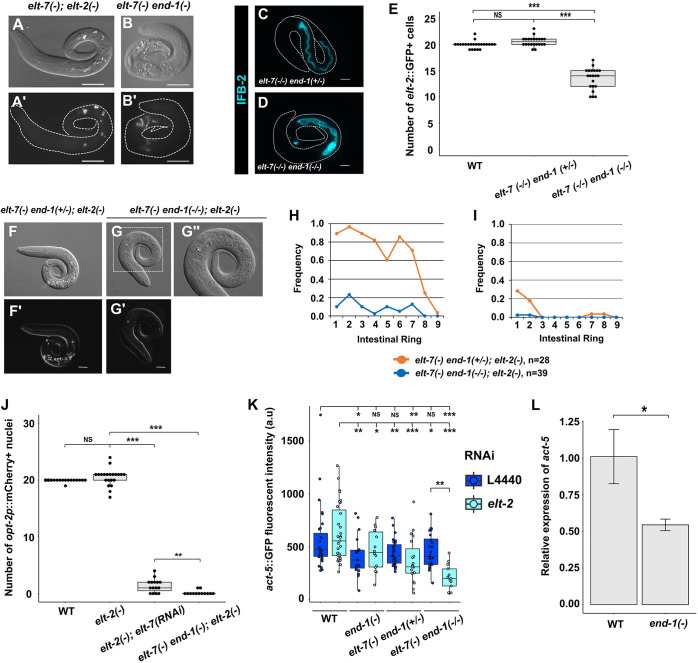
Fig. 2.
Synergistic actions of END-1, ELT-7 and ELT-2 mediate morphological differentiation of endoderm. (A,B) The elt-7(−) end-1(−) double mutant contains a defective gut with sporadic patches of rhabditin granules interspersed with apparently undifferentiated regions (n=82), similar to that seen in elt-7(−);elt-2(−) (n=148). Scale bars: 20 μm. (C,D) A balanced elt-7(−/−) end-1(−/+) larva shows uniform expression of IFB-2 (kcIs6) along the length of the animal (n=40), whereas the elt-7(−/−) end-1(−/−) larva shows sporadic expression of the transgene (n=42). Scale bars: 10 μm. (E) WT and elt-7(−/−) end-1(−/+) animals contain ∼20 intestinal cells, marked by the elt-2::GFP reporter. The number of differentiated gut cells is reduced in elt-7(−/−) end-1(−/−) (mean of 13.5 cells). (F,G) Representative micrographs of elt-7(−/−) end-1(+/−);elt-2(−) and elt-7(−/−) end-1(−/−);elt-2(−) mutants. elt-7(−/−) end-1(+/−);elt-2(−) animals (F,F′) lack a visible lumen and contain sporadic birefringent granules (n=28). elt-7(−/−) end-1(−/−);elt-2(−) animals (G,G′) exhibit no signs of endoderm differentiation at all (n=39). (G″) Magnified view of the boxed region shown in G. Scale bars: 10 μm. (H,I) The average frequencies of gut granules (H) and lumen (I) are reduced in elt-7(−/−) end-1(−/−);elt-2(−) compared with elt-7(−/−) end-1(+/−);elt-2(−). (J) WT and elt-2(−) animals show similar numbers of differentiated intestinal cells, although the variance in elt-2(−) is significantly increased (F-test, P<0.001). The number of opt-2p::mCherry (irSi24)-expressing cells is reduced in elt-2(−);elt-7(RNAi) animals. No gut cells were detected in the vast majority of elt-7(−) end-1(−);elt-2(−) triple mutants. (K) The expression of act-5::GFP translational reporter (jyIs13) in various mutant combinations. a.u., arbitrary units. (L) act-5 is downregulated in end-1(−) mutants compared to WT, as detected by RT-qPCR. act-1 was used as the internal reference. Three replicates were performed for each genotype. Error bars represent standard deviation. For box plots, boxes represent the 25-75th percentiles and the median is indicated. The whiskers show the 1.5× interquartile range. Statistical significance was determined by non-parametric Kruskal–Wallis test and pairwise Wilcoxon tests with Benjamini–Hochberg correction (E,J), parametric one-way ANOVA followed by pairwise two-tailed unpaired t-tests with Benjamini–Hochberg correction (K) and two-tailed unpaired t-test (L). NS, not significant (P>0.05); *P≤0.05; **P≤0.01; ***P≤0.001.

