Fig. 5.
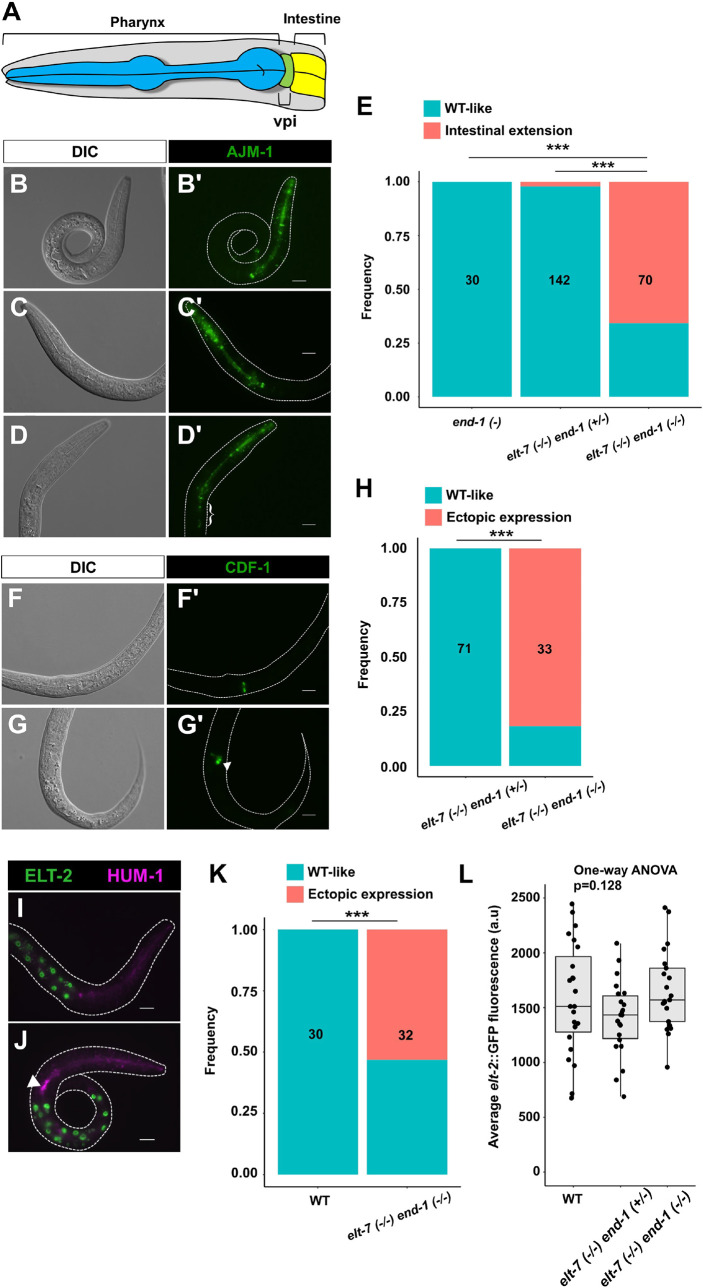
ELT-7 and END-1 function synergistically to repress ectopic expression of valve cell markers in the anterior gut. (A) Schematic of the anatomy of the pharynx, vpi and intestine. (B-D) The expression of the jcIs1[ajm-1::GFP] transgene appears similar to wild-type in end-1(−) (B,B′) and elt-7(−/−) end-1(+/−) (C,C′) animals. elt-7(−) end-1(−) (D,D′) shows caudal expansion of jcIs1 expression into the anterior gut (curly bracket). (E) The frequency of animals exhibiting ectopic expression of jcIs1. (F,F′) cdf-1::GFP expression is restricted to the vpi in elt-7(−) end-1(+/−) animals. (G,G′) Ectopic expression of cdf-1 reporter is observed in elt-7(−/−) end-1(−/−) animals (arrowhead). (H) The frequency of animals with ectopic cdf-1::GFP expression. (I) HUM-1 is highly expressed in the vpi in a wild-type animal as revealed by a CRISPR-tagged endogenous reporter. (J) Ectopic expression of hum-1 is observed in elt-7(−) end-1(−) (arrowhead). The intestinal cells are marked by elt-2::GFP. (K) Frequency of animals with ectopic hum-1::RFP expression. (L) The expression of ELT-2 is not altered in elt-7(−/−) end-1(+/−) and elt-7(−/−) end-1(−/−), compared with wild-type L1 larvae. a.u., arbitrary units. All scale bars: 10 μm. For panels E,H,K, the number of animals scored is indicated in each graph. ***P≤0.001 (Fisher's exact test).

