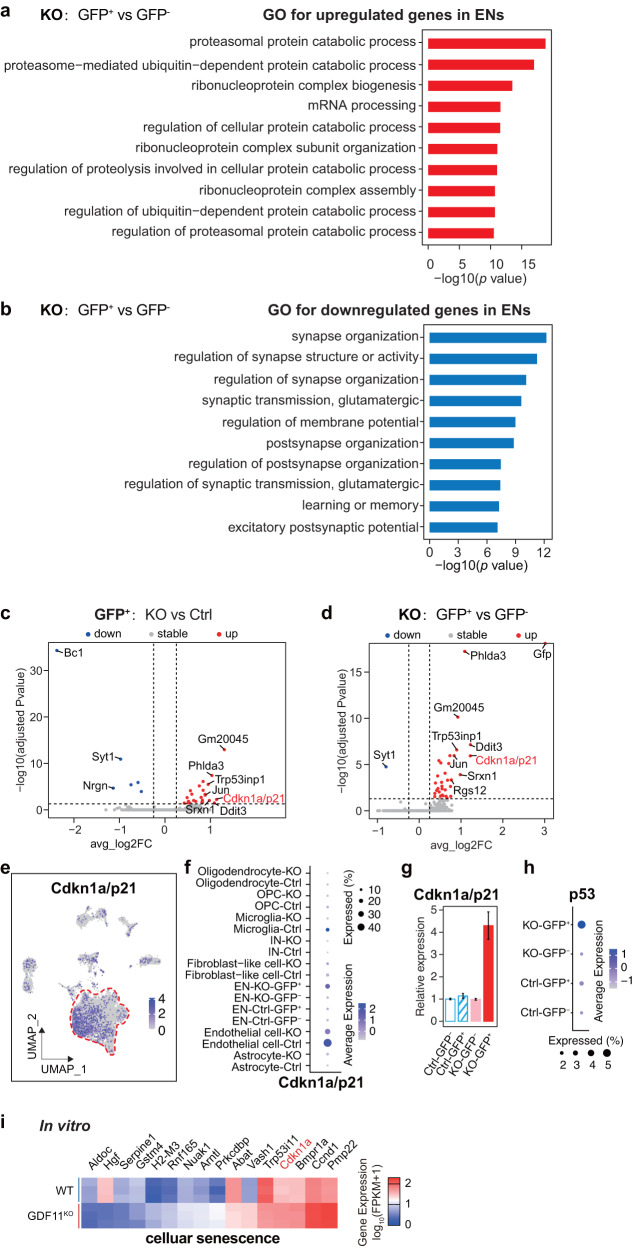
Fig. 6. Loss of GDF11 upregulates p21 both in vivo and in vitro.
a, b SnRNA-seq GO analysis reveals the top ten enriched biological processes of upregulated (a) or downregulated (b) in the KO-GFP+ EN in comparison with the KO-GFP- EN, and the EN were obtained from the Cg2 of the “KO” mice and the “Ctrl” mice aged 4–5 M. c Volcano plot shows upregulated and downregulated DEGs in the KO-GFP+ EN in comparison with the Ctrl-GFP+ EN. Some of the top upregulated and downregulated genes were annotated. c, d FC fold change. P value was calculated using Wilcox test and adjusted for multiple testing using Benjamini–Hochberg correction. d Volcano plot shows upregulated and downregulated DEG in the KO-GFP+ EN in comparison with the KO-GFP- EN. Some of the top upregulated and downregulated genes were indicated. e UMAP visualization highlights the distribution and the transcription of Cdkn1a/p21 in the identified cell types in snRNA-seq. f Dot plot representing the frequency and average transcription of Cdkn1a/p21 in the identified cell types in snRNA-seq. g, h Relative mRNA of Cdkn1a/p21 (g) or p53 (h) among four types of EN: Ctrl-GFP-, Ctrl-GFP+, KO-GFP- and KO-GFP+ by snRNA-seq. i Heatmap of upregulated (10) and downregulated (6) genes involved in “cellular senescence” caused by deletion of GDF11 in Neuro-2a cells, and the logarithm base 2 of the fold change above 1 or below −1 was included. Data are presented as mean ± SEM. *P < 0.05, **P < 0.01 and “ns” indicates not significant. a, b Hypergeometric test with Benjamini and Hochberg (BH) correction. Source data are provided with this paper.

