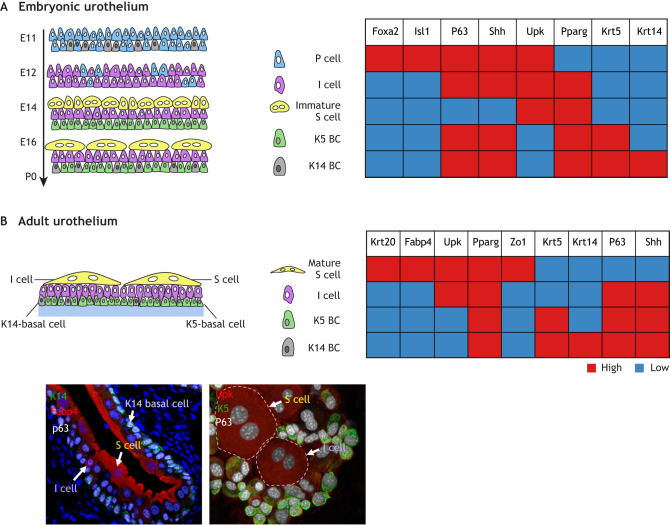
Fig. 1.
Schematic of urothelial development and homeostasis. (A) Formation of the mouse embryonic urothelium. The image (left) depicts changes in urothelial cell types as the tissue develops (from E11 to P0). The plot (right) highlights some of the key genes expressed in each cell type; red indicates high expression, blue indicates low expression. (B) Composition of the adult mouse urothelium. The image (left) depicts the cell types present within the adult urothelium. The plot (right) highlights some of the key genes expressed in each cell type. Sections through the adult urothelium (bottom panels) showing expression of combinatorial markers in urothelial populations. Isl1, islet 1; K5-basal cell, Krt5-expressing basal cells; K14-basal cells, Krt14-expressing basal cells; P cell, progenitor cell; P63, tumor protein P63 (also known as TRP63); Pparg, peroxisome proliferator-activated receptor γ; S cell, superficial cell; Shh, sonic hedgehog; Upk, uroplakin; Zo1, zona occludens 1.

