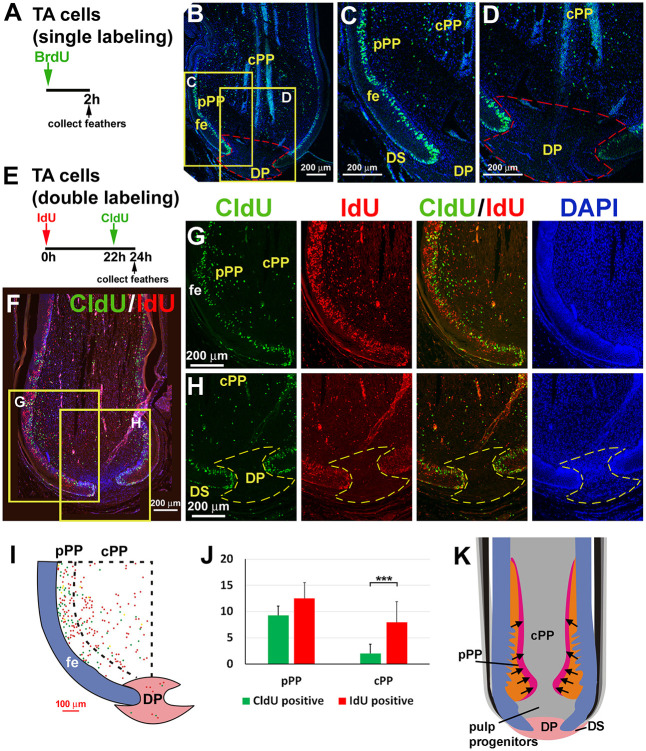
Fig. 2.
The behavior of TA dermal cells during feather cycling. (A) Strategy of pulse BrdU TA cell labeling. (B) BrdU staining of an early growth-phase contour feather follicle. (C,D) Higher magnification of PP (C) and DP (D) regions (yellow boxed areas in B). (E) Strategy of double TA cell labeling. The thymidine analogs IdU and CldU are injected at different time points. (F) Double staining of an early growth-phase follicle labeled with CldU for 2 h (green) and IdU for 24 h (red), respectively. (G,H) Higher magnification views of the pulp (G) and DP (H) regions (yellow boxed areas in F). First column, 2-h CldU labeling; second column, 24-h IdU labeling; third column, combined; fourth column, DAPI staining. Red streaks in the cPP region are blood vessels. (I) Diagram showing CldU-positive (green dots) and IdU-positive (red dots) cells. Dotted line separates the pPP from the cPP. The percentages of CldU- and IdU-positive cells were calculated (n=5 feather follicles, ***P<0.001, paired two-tailed Student's t-test). (J) Percentage of CldU- and IdU-positive cells in pPP versus cPP. Data are mean±s.d. (K) Schematic summary showing the dermal TA cell population and potential migration trend in early growth-phase follicles. Black arrows indicate the dermal cell migration route in PP. Dashed lines in B, D and H outline the DP. cPP; central pulp; DP, dermal papilla; DS, dermal sheath; fe, feather epidermis; pPP, peripheral pulp.

