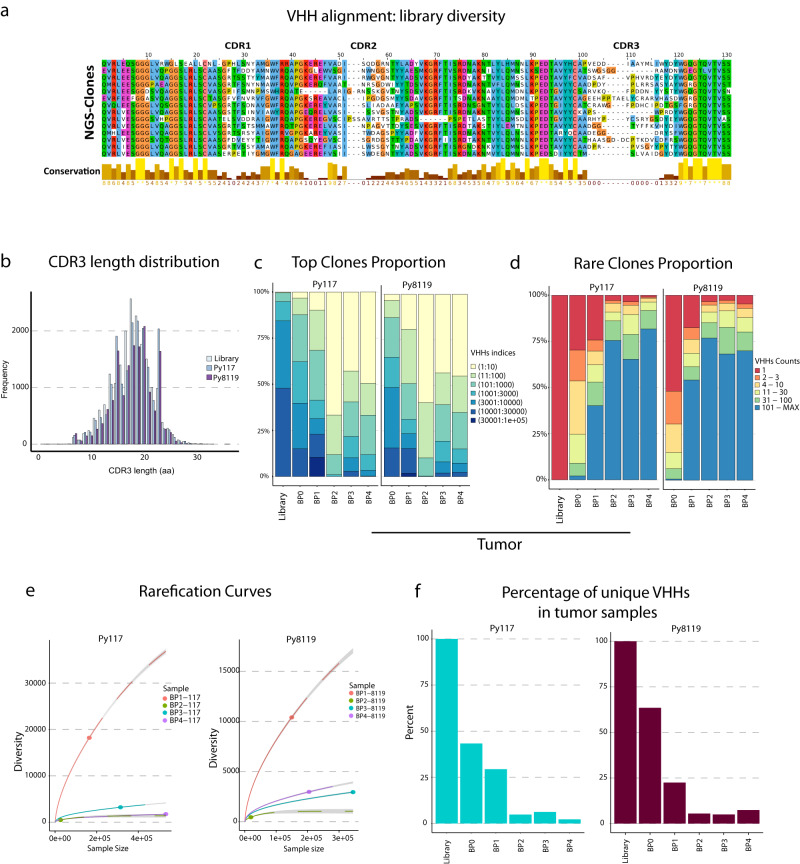
Fig. 2. Diversity and enrichment across in vivo biopanning to validate the approach.
a VHH alignment showing the diversity in CDR1, CDR2 and CDR3 regions. b Frequencies of CDR3 amino acid length in the library, Py117 and Py8119 samples demonstrate an equal distribution across the samples with a median length of 18 aa. Top clone proportion (c) and rare clonal proportion (d) showing summary proportion of VHHs with specific indices and counts in Py117 and Py8119 tumor samples from BP0 to BP4. e Rarefication curve assessed the diversity of BP1 to BP4 in Py117 and Py8119 tumor samples through extrapolation and subsampling showing the reduction in diversity after BP1. f Percentage of unique VHH numbers in tumor samples of Py117 and Py8119.

