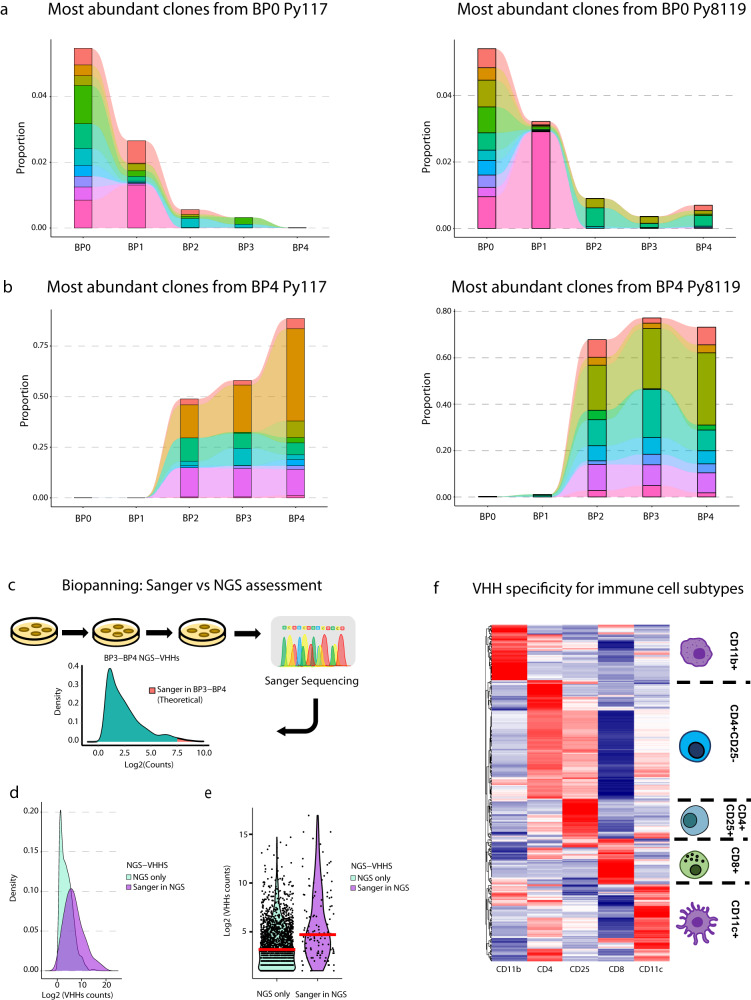
Fig. 3. Selection and evaluation of nanobodies developed by in vivo biopanning.
Tracking Top VHHs either in BP0 towards BP4 (a) or in BP4 backward to BP0 (b) demonstrates the biological enrichment of the biopanning process in vivo. c Distribution of VHHs’ density after biopanning, where titration followed by Sanger sequencing theoretically provides the most abundant clones, such as the top 25%. and NGS allows for deeper assessment of biopanning with a boarder range of assessment at a multiplexed scale. d Experimental distribution of abundance by density of all enriched clones in BP3 and BP4 identified by NGS only or clones also identified by Sanger showing deeper identification of enriched clones where Sanger identified the most abundant clones. e Log2 counts of clones identified by NGS in BP3-BP4 from all cell sub-types (n = 2087 clones) in compared to clones selected for Sanger sequencing clones (n = 156 clones), median represented by red line. f Relative enrichment of VHHs in each row across the five cell subtypes from BP3-4 that identify VHHs with cell type specificity.

