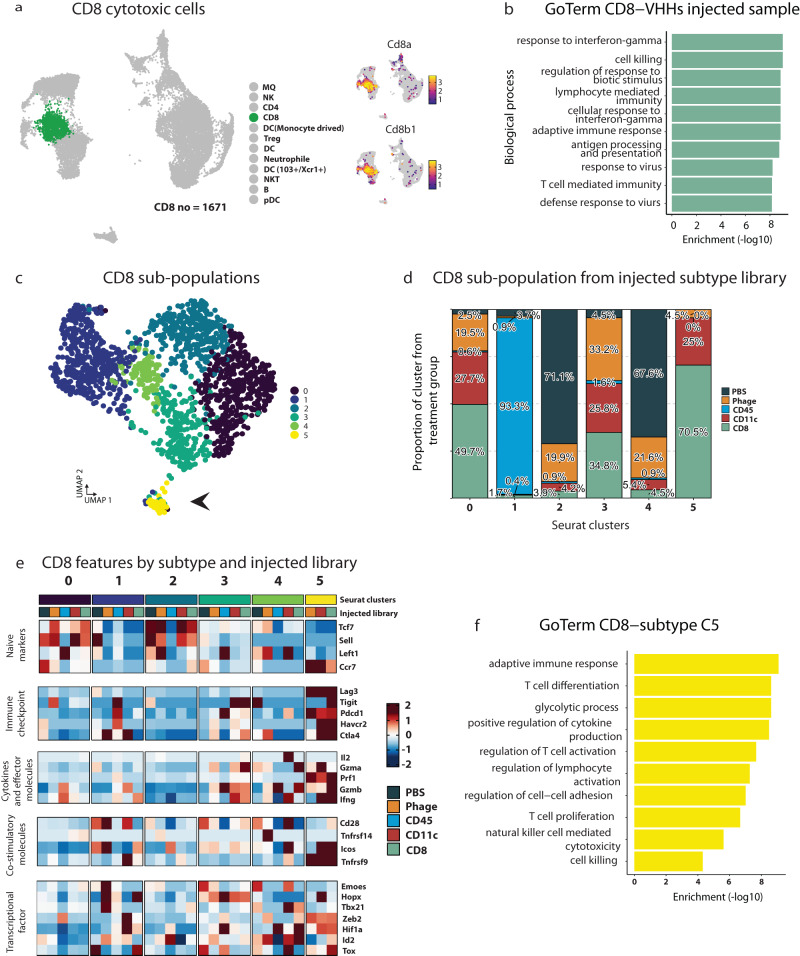
Fig. 6. Transcriptional changes introduced by CD8 VHHs injected library.
a CD8 T cells and expression of their canonical markers. b GO term enrichment of upregulated genes in CD8-VHHs library injected mice in CD8 T cells were performed using enricher package, significance was determined by Fisher exact test (−log10) of adjusted p value by benjamini-hochberg (BH) method. c UMAP plot showing the CD8 sub-populations by sub-clustering CD8 T cells. Black arrows refer to sub-population cluster 5. d Histogram showing relative distribution of CD8+ T cell sub-populations based upon sample type. e Heatmap showing naïve markers, immune checkpoint, cytokines and effector molecules, co-stimulatory molecules, and transcriptional factor genes expression in CD8 T cells sub-populations and injected libraries. f GO term enrichment of upregulated genes in CD8-VHHs library injected mice in CD8 T cells cluster 5, enrichment was performed using enricher package, significance was determined by Fisher exact test (−log10) of adjusted p value by benjamini-hochberg (BH) method. Source data are provided as a Source Data file.

