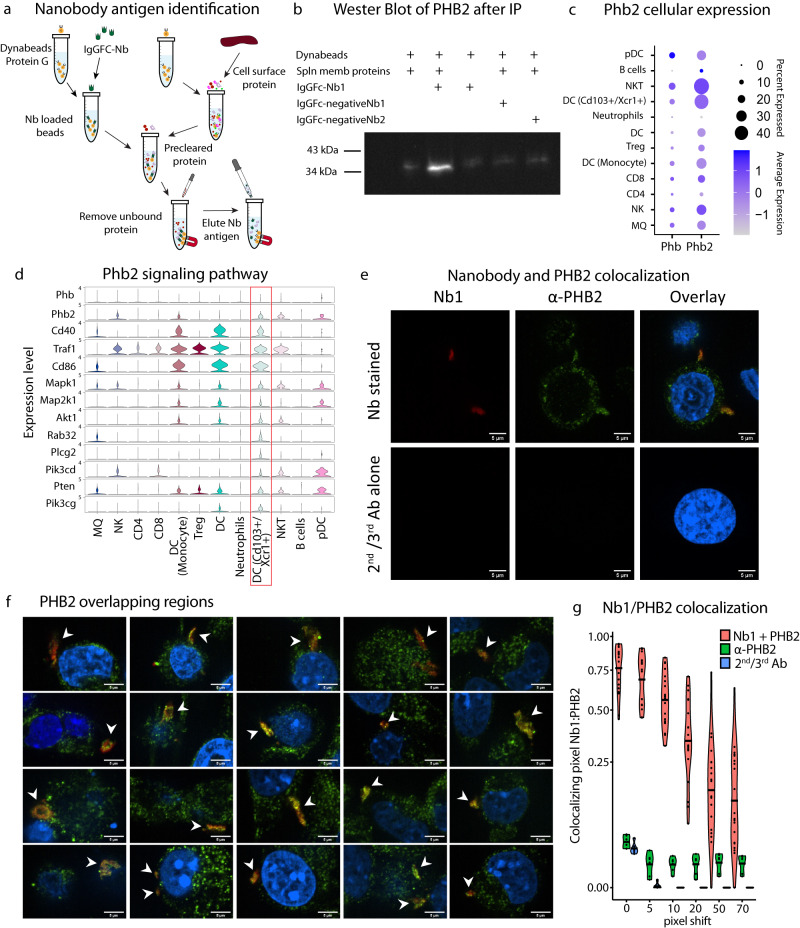
Fig. 8. Identification and verification of Nb1 binding to Phb2.
a Nanobody pull-down and antigen identification pipeline using immunoprecipitation. b Western blot of α-PHB2 protein after pulled-down by Nb-FC fusion protein (IgGFC-Nb1) (representative of 3 independent experiments) c Dot plot for Phb and Phb2 expression across immune cell populations. d Violin plot showing the Phb2 signaling pathway across immune cells populations, revealing the greatest expression in the DC CD103+/Xcr1+ population (red box). e Representative confocal images from two independent experiments of Nb1 and PHB2 colocalization in MC38 cells with the upper row Nb1/α-PHB2 stained and lower row secondary and tertiary antibody alone control. The first column is the nanobody channel red, then α-PHB2 green, and the overlay with Höchst 33342 blue (scale 5 μm). f Representative confocal images from two independent experiments of Nb1 colocalization with membranous regions expressing PHB2 from 20 different cells (white arrows). g Mander’s colocalization coefficient M1 of Nb1 pixel overlapping PHB2 pixel (mean represented by black line) for Nb1 and α-PHB2 (n = 20 images), α-PHB2 antibody alone (n = 6) and 2nd/3rd antibodies alone (n = 6) from two independent experiments with six incrementing pixel shift configurations. Source data are provided as a Source Data file.

