
Figure 5.
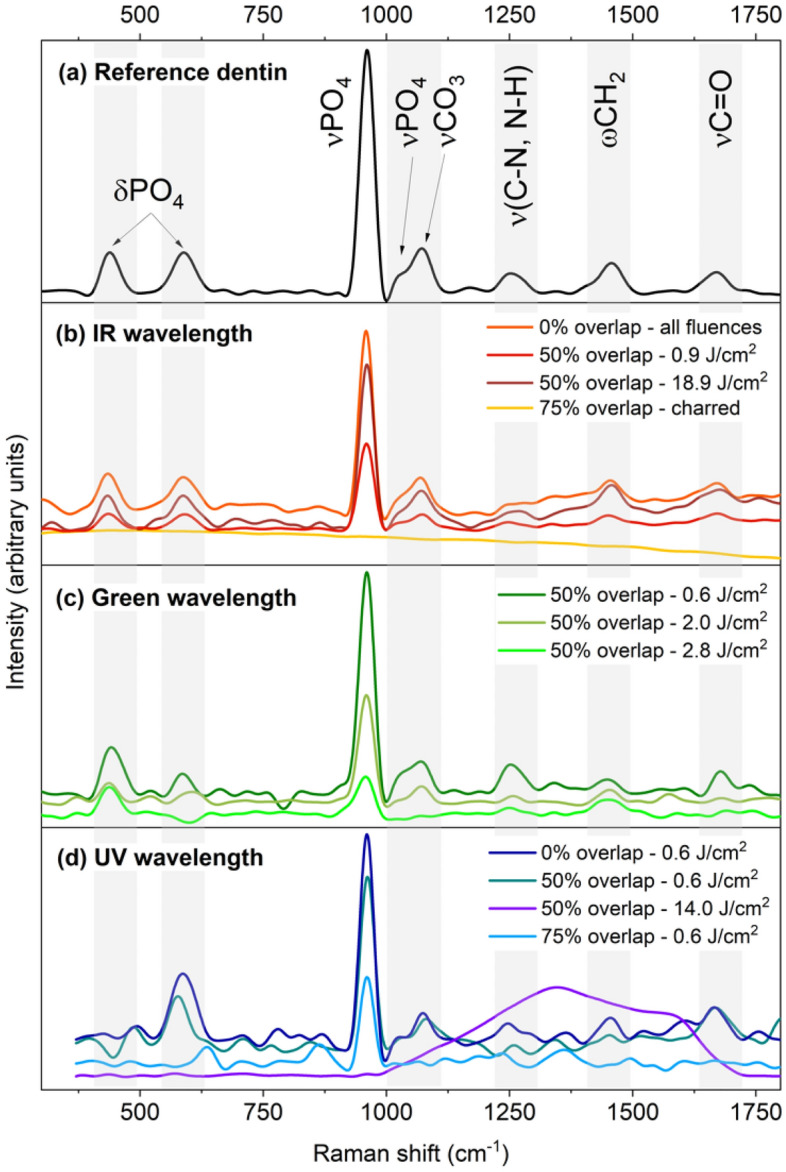
Raman spectroscopy of femtosecond laser processing of dentin at the three tested wavelengths: (a) reference spectrum of dentin with peak attributions from3 (δ: bending; ν: stretching; ω: wagging), (b) spectra for IR (1030 nm) irradiation at various fluences and overlap, (c) for green (515 nm) irradiation at different fluences and 50% overlap, and (d) for UV (343 nm) irradiation at different fluences and overlap. Grey bands indicate the various peak positions for clarity.