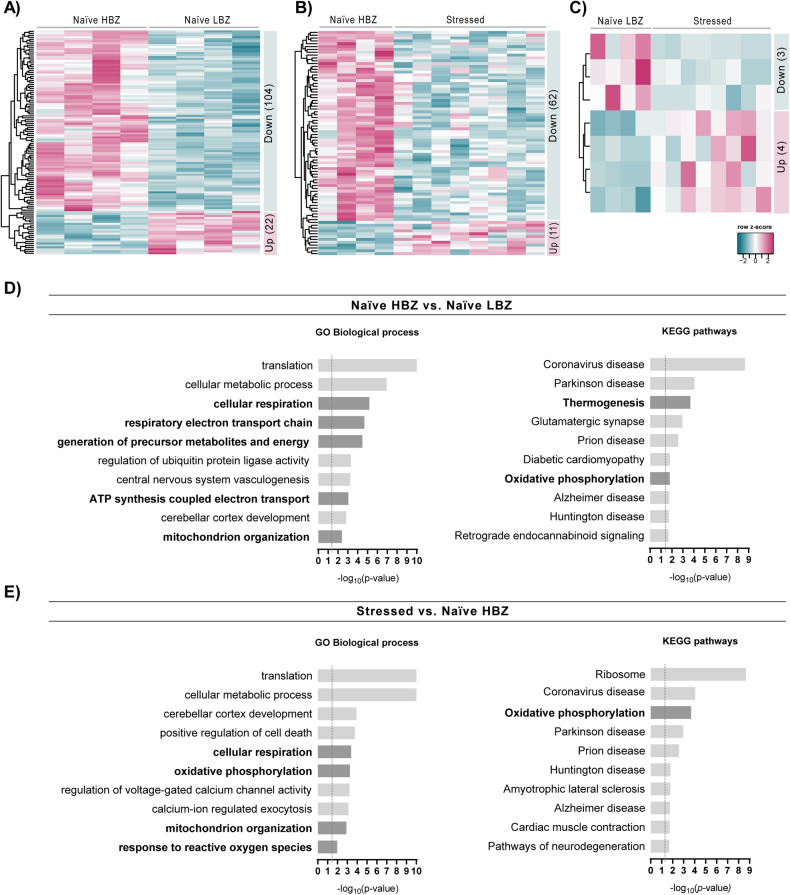
Fig. 3. Gene expression changes in the PFC of naïve LBZ and stressed animals.
Heatmap of normalized mRNA expression levels of differentially expressed genes (DEGs, padj < 0.1) in the PFC comparing A naïve LBZ vs. naïve HBZ, B naïve HBZ vs. stressed animals, and C naïve LBZ vs. stressed animals. The overall numbers of DEGs up and down-regulated are described in their respective heatmaps. The dendrograms represent the hierarchical clustering of genes according to gene expression (Euclidean distance method). D Gene set enrichment analyses of DEGs in the PFC of naïve LBZ and E stressed animals compared to naïve HBZ. Mitochondria-associated pathways are highlighted in black font.

