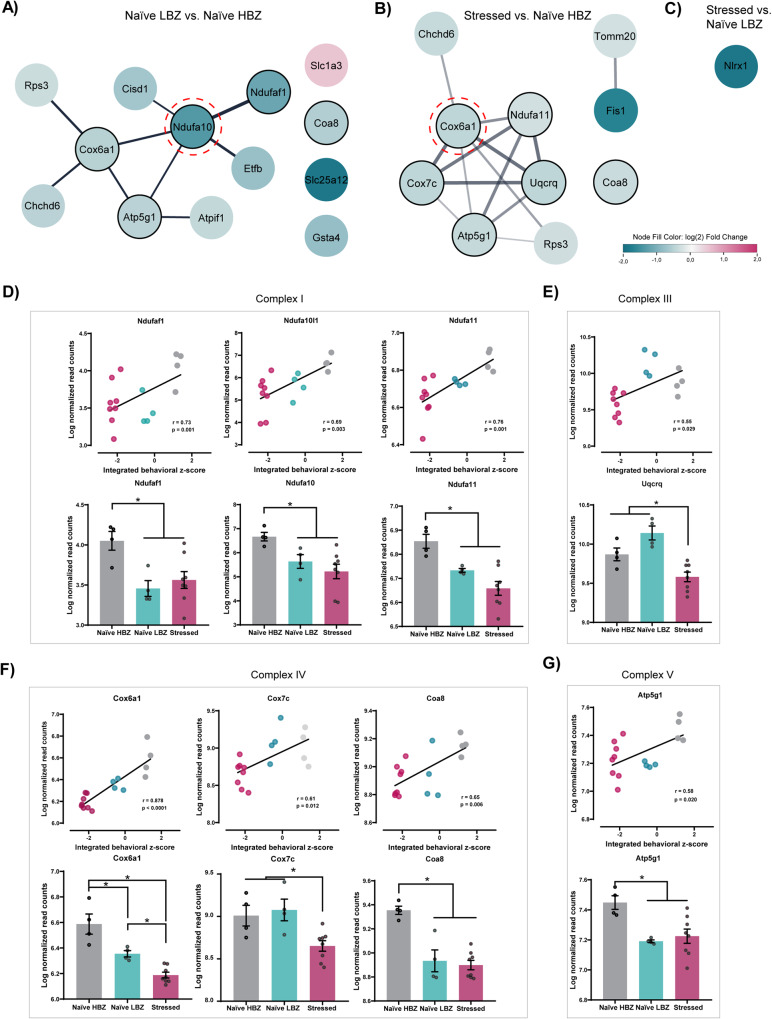
Fig. 4. Expression profiles of mitochondria-related genes in the PFC in different adolescent behavioral phenotypes.
Summary of DEGs maintained by Cytoscape mitochondrion-node filter from A naïve LBZ vs. naïve HBZ, B stressed animals vs. naïve HBZ, and C stressed animals vs. naïve LBZ. The node’s colors represent the corresponding genes’ relative expression (log2(Fold Change)). Nodes rounded with red lines correspond to central identifiers in the network topology analysis. Nodes rounded with black lines correspond to genes from different OXPHOS complexes and were used to correlate the normalized gene expression levels with the integrated behavioral z-score and distinguish gene expression profiles among intergroups. Lines (edges) represent predicted gene–gene interaction. D–G A positive Pearson correlation was observed between the expression levels of OXPHOS genes and behavioral phenotype. r and p values are described in the graphs. Levels of gene expression from different OXPHOS complexes were significantly different among groups: D Complex I = Ndufaf1 (F2,13 = 6.16, p = 0.01), Ndufa10 (F2,13 = 5.63, p = 0.02), and Ndufa11 (F2,13 = 11.80, p = 0.001). E Complex III = Uqcrq (F2,13 = 14.70, p = 0.0005). F Complex IV = Cox6a1 (F2,13 = 25, p < 0.0001), Cox7c (F2,13 = 11, p = 0.001), and Coa8 (F2,13 = 19.4, p = 0.0001). G Complex V = Atp5g1 (F2,13 = 7.21, p = 0.008). Data are shown as mean ± SEM. *p < 0.05; One-way ANOVA, followed by Tukey’s multiple comparison test.

