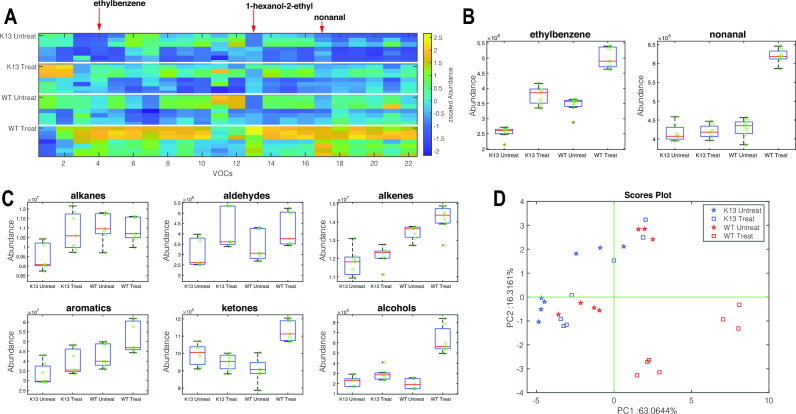
Figure 2.
Volatile metabolites in artemisinin treated and untreated Wild-Type (NF54) and K13 artemisinin resistant (NF54-C580Y) Plasmodium. (A) the abundance of a set of recurrent 22 VOCs shown as a heatmap. To enable comparison between VOCs with different abundances, the abundance of each VOC is normalized in the [0,1] range. Each plot is headed with the smallest p-value returned by the Kruskal–Wallis test. (B) distribution of compounds showing the largest change after drug administration. (C) Distribution of the cumulative abundance of the major chemical families in the four groups of samples. (D) Plot of the first two principal components of the PCA calculated with standardized data shown in Fig. 2A.

