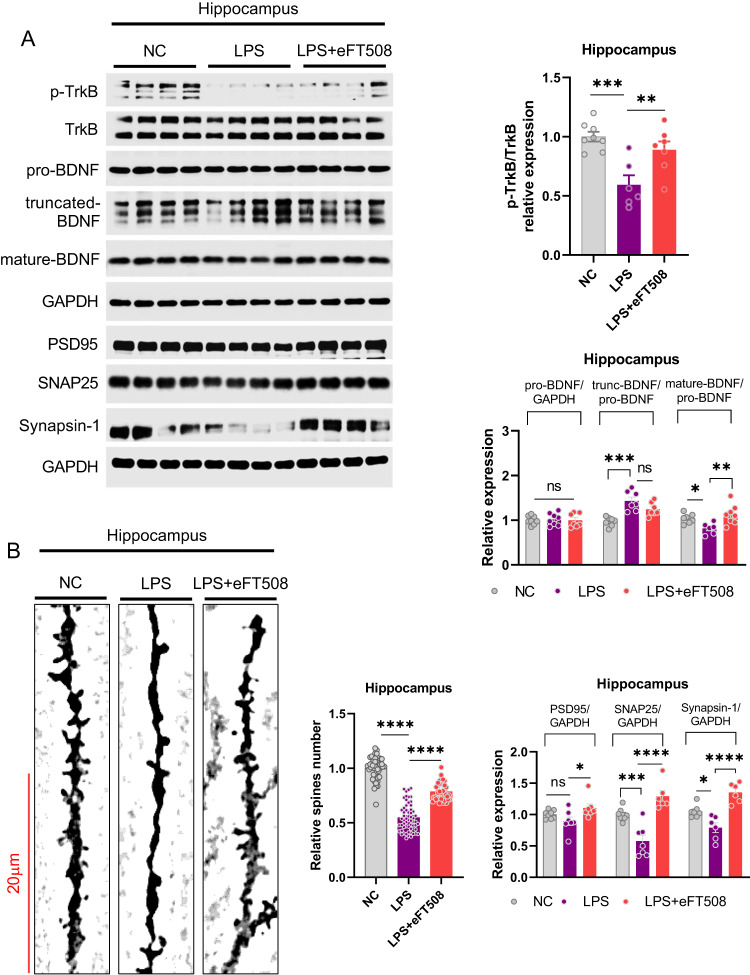
Fig. 4. eFT508 treatment rescued LPS-induced synaptic defects.
A Representative western blot images with corresponding column graph showing TrkB/pro-BDNF/truncated-BDNF/mature-BDNF and PSD95/SNAP25/Synapsin-1 expression (n = 6–8). B Golgi staining shows spine density, with the corresponding column graph showing the relative number of spines (n = 6–8). All the values are expressed as mean ± SEM, one-way ANOVA followed by Turkey’s multiple comparison tests. *p < 0.05, **p < 0.01, ***p < 0.001, ****p < 0.0001.

