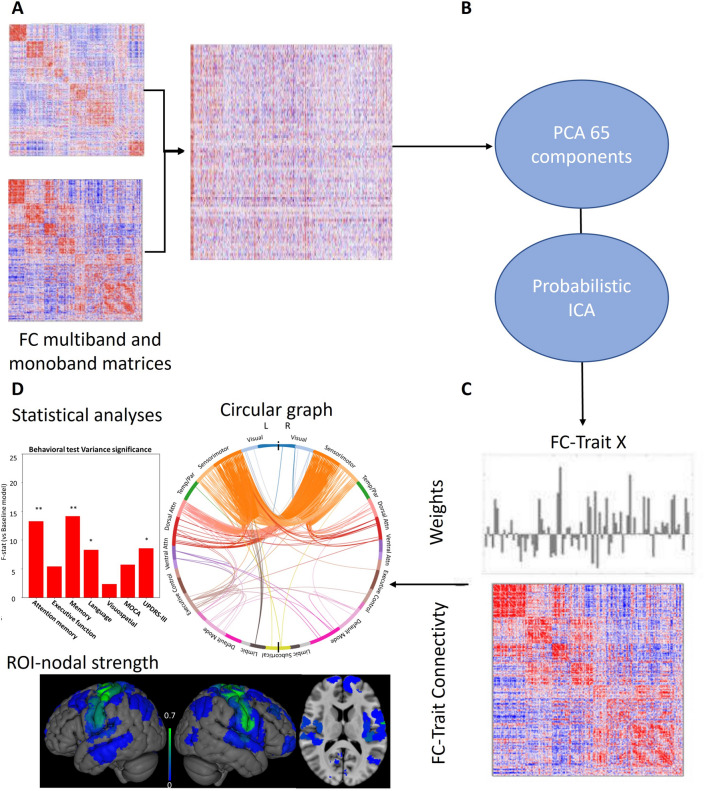
Figure 2.
ConnICA FC-traits extraction process. (A) Multiband and monoband FC matrices were computed for each subject and the FC coefficients in the upper-triangular matrix were vectorized and concatenated into a group FC matrix. (B) The dimensionality of the group FC matrix was reduced to 65 components based on optimal subject identifiability. Then, the ConnICA decomposition was applied so that (C) the group FC matrix was decomposed into spatially independent functional connectivity components (a.k.a. FC-traits) and their corresponding weights for each FC matrix. (D) After testing for significant differences between groups, each functional trait was characterized by a circular graph, a nodal strength map and ANOVA regressions to neurophysiological assessments.

