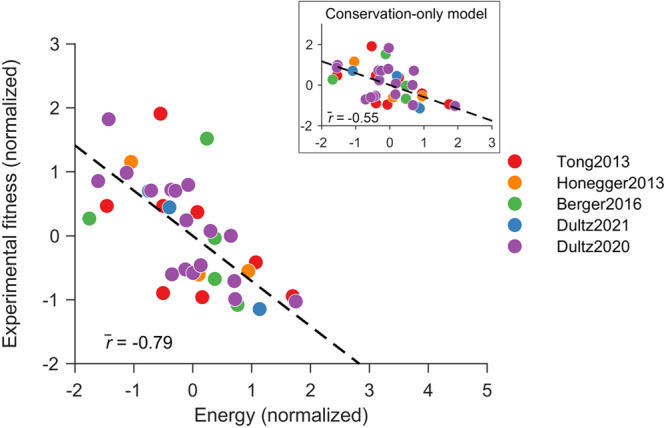
Fig. 1. Correlation between the sequence energy obtained from inferred NS3 fitness landscape and in-vitro infectivity measurements.

Normalized energy values computed from the inferred model correlate strongly with the experimental fitness measurements. In contrast, a conservation-only model provided a much lower correlation (inset). The legend shows references for fitness/infectivity measurements9,10,21,28,29. Normalization of fitness measurements and predicted model energies was performed by subtracting the mean from each data set and dividing by its standard deviation. Source data are provided as a Source Data file.
