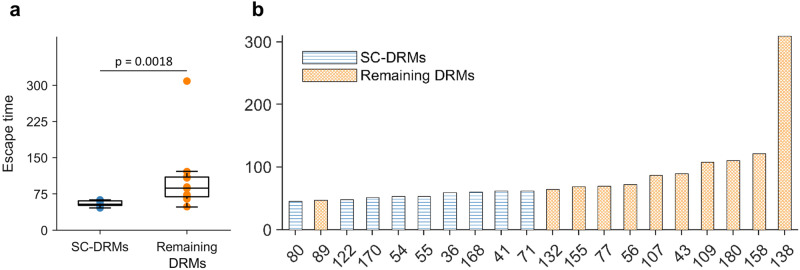
Fig. 6. Escape time of residues involved in NS3 DRMs.
a Comparison between escape time of residues involved in SC-DRMs and the remaining residues involved in DRMs. In each box plot, the middle line indicates the median, the edges of the box represent the first and third quartiles, and whiskers extend to span a 1.5 interquartile range from the edges. The reported p-value was calculated using the two-sided Mann–Whitney test (n1 = 9 SC-DRMs and n2 = 11 remaining DRMs). b Individual escape time of residues involved in DRMs of the NS3 protein. SC-DRMs are shown in blue and the remaining DRMs in orange. Source data are provided as a Source Data file.

