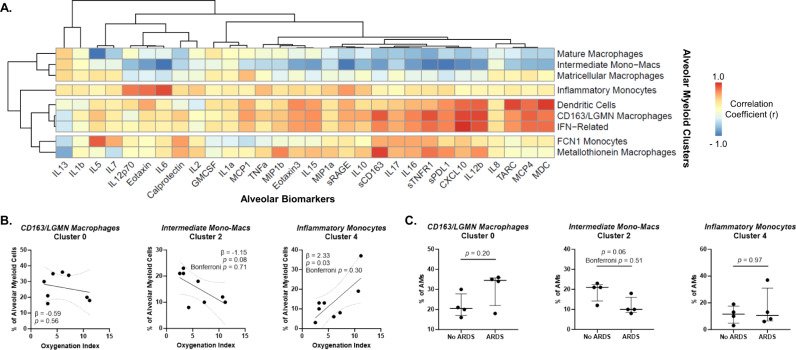
Fig. 2. Correlations between alveolar myeloid subsets, biomarker profiles, and clinical severity.
A Heatmap of the correlation coefficients between alveolar myeloid subset proportions (y-axis) and log2 alveolar biomarker levels (x-axis). Colors represent the correlation with scale indicating value of Pearson’s r correlation. Axes are ordered by clustering based on Pearson correlation-distances using pheatmap. B Associations between the proportion of alveolar myeloid subsets as a percentage of all alveolar myeloid cells (y-axis) and oxygenation index (OI) (x-axis). OI is a measure of respiratory failure severity that accounts for both oxygenation and mean airway pressure being delivered by mechanical ventilation. Higher values indicate more severe respiratory failure. Depicted are the individual values, linear regression best-fit line, and 95% confidence intervals (n = 8 unique participants). P-values test whether the slope (β-coefficient) is significantly non-zero and are nominal. Bonferroni p-values are adjusted for 9 statistical tests (multiple hypothesis testing for an association between each of the nine subsets and the clinical outcome). C The percentage of each alveolar myeloid subset as a proportion of all alveolar myeloid cells in participants with or without ARDS. Depicted are the individual values, median, and interquartile range of each subset as a proportion of all alveolar myeloid cells (n = 8 unique participants). P-values were generated with two-sided Mann-Whitney tests and are nominal. Bonferroni p-values are adjusted for 9 statistical tests (multiple hypothesis testing for an association between each of the nine subsets and the clinical outcome).

