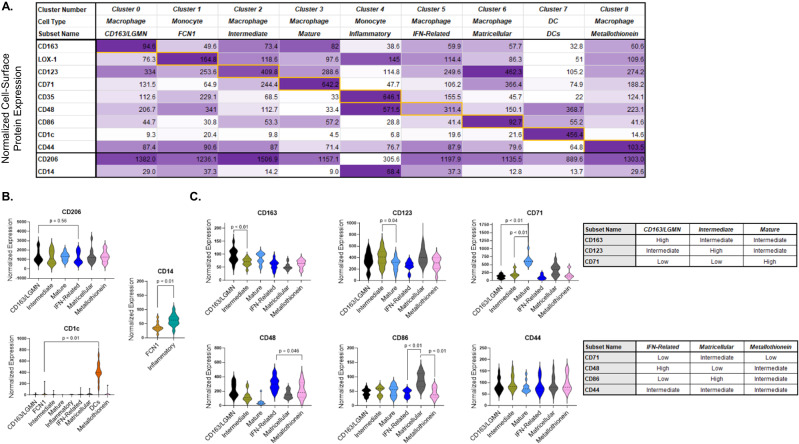
Fig. 4. Cell-surface protein markers distinguish alveolar monocyte and macrophage subsets.
We used feature barcodes to identify the cell-surface proteins that best discriminated each alveolar myeloid transcriptional subset. A Table displaying the 9 most differentially expressed cell-surface proteins (y-axis) across nine alveolar myeloid cell transcriptional subsets (x-axis). Data on CD206 and CD14 are included at the bottom as a reference. The color intensity is proportional to the average scaled log-normalized expression for each cell-surface protein. Supplementary Data 1 shows the cell-surface protein intensities for each subset. B The normalized expression for each cell-surface protein (y-axis) for each transcriptional subset (x-axis). Depicted are violin plots (including median, interquartile range, and 1.5x interquartile range). The p-value was generated with a two-sided T-test of the pair-wise comparison between the two subsets with the largest difference in CD206 expression. C The normalized expression for each cell-surface protein (y-axis) for each transcriptional subset (x-axis). Depicted are violin plots (including median, interquartile range, and 1.5x interquartile range). P-values were generated with two-sided T-tests. The tables on the right summarize the relative cell-surface protein expression levels for each alveolar macrophage transcriptional subset.

