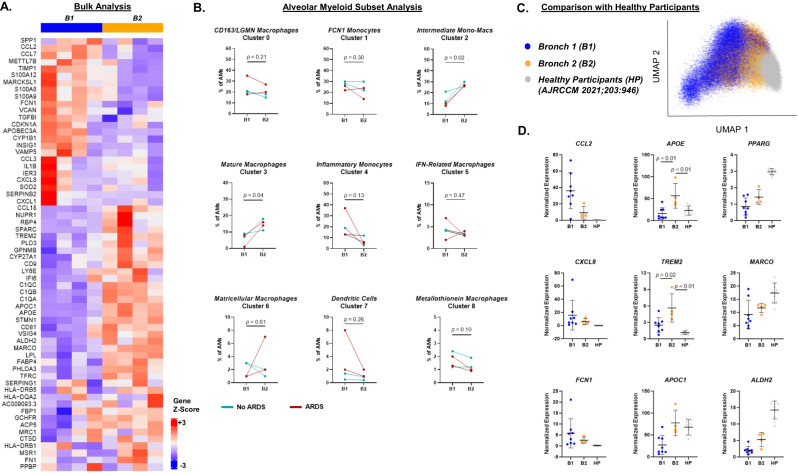
Fig. 6. The proportions of alveolar myeloid subsets evolve during acute hypoxemic respiratory failure.
A Heat map showing differentially expressed genes in bulk alveolar myeloid cells between Bronchoscopy 1 (B1) and Bronchoscopy 2 (B2). B The percentage of each alveolar myeloid subset as a proportion of all alveolar myeloid cells at B1 and B2. Depicted are the individual values and lines connecting paired samples (n = 4 unique participants). P-values were generated with paired two-sided T-tests. Participants who met criteria for ARDS are shown in red. C UMAP plot incorporating our dataset with single-cell gene expression data from healthy human participants (HP) who underwent BAL8. Color designates assignment of cells to either B1, B2, or HP. D Normalized gene expression of select genes between participants in B1 (n = 8), B2 (n = 4), and HP (n = 9). Depicted are the individual values, mean, and standard deviation of each subset as a proportion of all alveolar myeloid cells. P-values were generated with a two-sided T-test.

