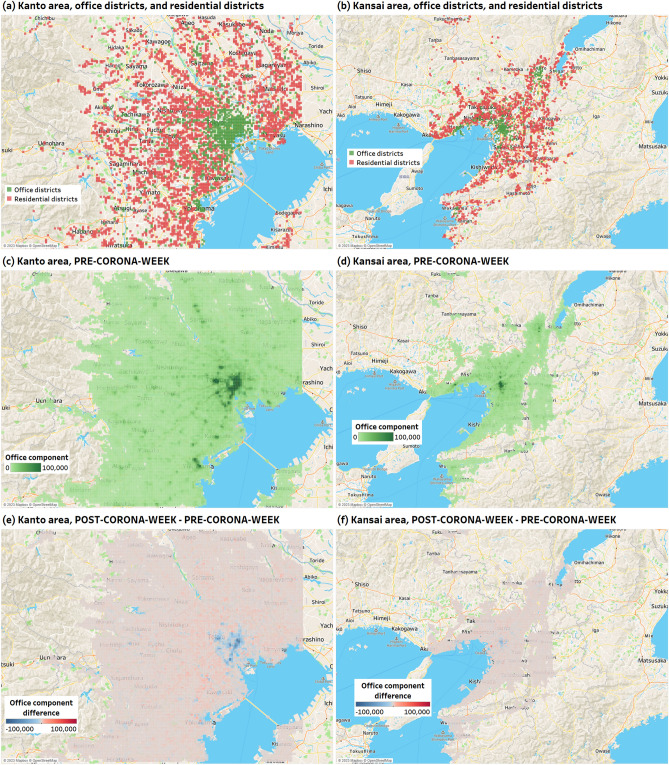
Figure 3.
(a) and (b) Are the distribution of HGS determined to be office districts or residential districts in the Kanto area and the Kansai area, respectively. (c) and (d) Are heat maps of the office component in the Kanto area and Kansai area on PRE-CORONA-WEEK, respectively. (e) and (f) Are heat maps of the difference between POST-CORONA-WEEK and PRE-CORONA-WEEK (POST-CORONA-WEEK - PRE-CORONA-WEEK) for office components in the Kanto area and Kansai area, respectively. These figures were all generated using Tableau Desktop Professional Edition version 2021.1.1548.

