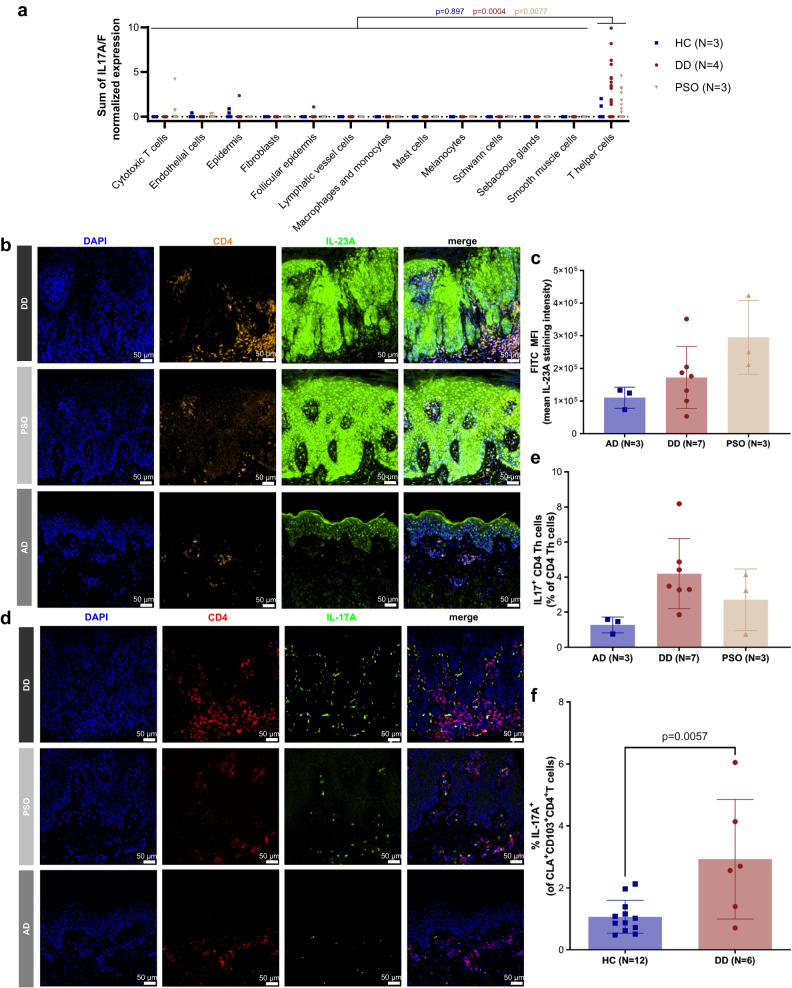
Fig. 2. Increased numbers of Th17 cells in lesional skin of DD patients.
a Sum of IL17A/F normalized expression in different cell types of healthy controls (HC, N = 3, 12817 cells), Darier Disease patients (DD, N = 4, 3746 cells) and Psoriasis patients (PSO, N = 3, 11417 cells) skin samples as determined by scRNA-seq analysis. Significance bars represent results of one-tailed student’s T-test of IL17A/F expression between T helper and non-T helper cells within one group (blue p-value for HC, red p-value for DD, beige p-value for PSO), without adjustment for multiple comparisons. b Representative multi-color immunofluorescence (IF) images of tissue micro array sections stained with OPAL technique for IL-23A, CD4 and DAPI in skin samples of DD patients (N = 7), atopic dermatitis patients (AD, N = 3) and PSO (N = 3). CD4 positive T cells are marked in red, IL-23A positive cells are marked in green, DAPI-stained nuclei are marked in blue. Isotype controls are shown in Suppl. Fig. 5. c Quantification of IL-23A positive cells as determined by mean fluorescence intensity of multi-color immunofluorescence stained TMA sections (skin samples: DD (N = 7, red), PSO (N = 3, beige), AD (N = 3, blue)). d Representative multi-color immunofluorescence (IF) images of tissue micro array sections stained with OPAL technique for IL-17A, CD4 and DAPI in skin samples of DD patients (N = 7), atopic dermatitis patients (AD, N = 3) and PSO (N = 3). CD4 positive T cells are marked in red, IL-17A positive cells are marked in green, DAPI-stained nuclei are marked in blue. Isotype controls are shown in Suppl. Fig. 5. e Quantification of IL17A/CD4/DAPI triple-positive cells of multi-color immunofluorescence stained TMA sections (skin samples: DD (N = 7, red), PSO (N = 3, beige), AD (N = 3, blue)). f IL-17A production of live gated human CD3+CD4+CD45RA-CLA+CD103+ circulating skin-resident memory T cells (cTRM) in the blood of DD patients (red) compared to HC (blue). Flow cytometric analysis of IL-17A upon ex vivo stimulation with PMA/ionomycin and intracellular cytokine staining. p-values were calculated using unpaired, two-tailed student’s t test. Gating strategy is shown in Suppl. Fig. 7.

