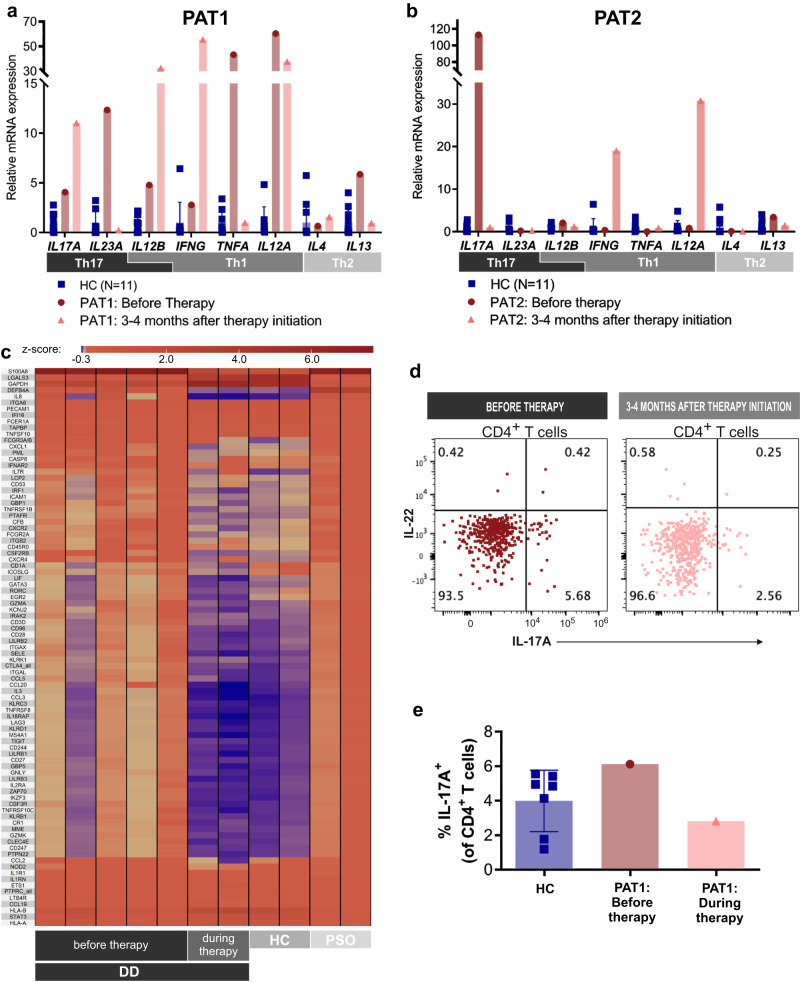
Fig. 4. Normalization of the inflammatory gene expression profile and Th17 cell numbers in DD patients treated with anti-IL-17/IL-23 antibodies.
a, b Relative mRNA expression (qRT-PCR) of Th1, Th2, and Th17-associated cytokines normalized to housekeeping gene ACTB and relative to HC for PAT1 and PAT2. Bars represent means of different individuals; error bars represent standard deviations. c Normalization of gene expression during therapy of differentially regulated genes (DD vs HC) in DD patients determined by NanoString nCounter analysis using the Immunology_V2 panel. Genes represent DE genes expressed as Z-score (DD vs HC, fold change >1.5). d Assessment of Th17 cell counts with multiplex flow cytometry in skin samples from PAT1 before and during therapy with guselkumab. Dot plot of IL-22 and IL-17A expression of CD4+ T cells of PAT1 before therapy initiation (red) and during therapy (salmon, 3.5 months after therapy initiation). Gating strategy is shown in Suppl. Fig. 10. e Quantification of results in d compared to HC (blue, N = 7), PAT1 before therapy initiation (red) and PAT1 during therapy (salmon). Individual symbols represent different donors, error bars represent standard deviation.

