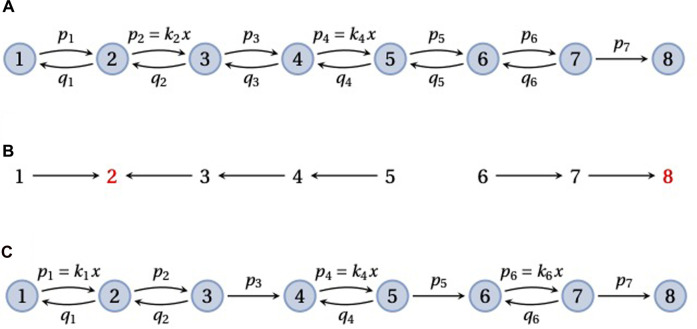
FIGURE 5.
Pipeline graphs. (A) A pipeline graph on 8 vertices that consists of a single reversible block, with substrate binding with concentration x at the edges 2 → 3 and 4 → 5, followed by a single irreversible transition, 7 → 8. (B) The spanning forest F(2, 6, 8), in the notation described in the text, for the graph in panel A. The two roots, 2 and 8, are in red font. (C) A pipeline graph with three reversible blocks, in each of which the substrate binds once. As explained in the text, the mean FPT, , has a reciprocal Michaelis–Menten dependence on the substrate concentration, x, as in Eq. 15.

