Figure 1.
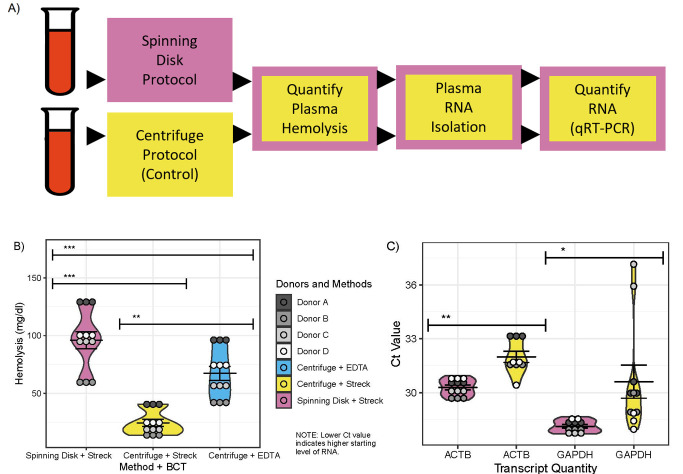
1A. Analytical Workflow Evaluating the Spinning Disk Method for Plasma RNA Isolation. A visual representation of the comparative workflow used to test the spinning-disk method (test, pink boxes) and two-spin centrifuge method (control, yellow boxes) using blood collected in Streck Complete RNA (Streck) tubes. Samples drawn in EDTA tubes (not included in the workflow figure), were treated with the two-spin centrifuge method and evaluated for hemolysis, but not evaluated for RNA quantity. 1B. Hemolysis Profiles of Plasma Samples Isolated with Different Methods. Hemolysis was measured in plasma extracted from blood, which were collected in either Streck tubes or EDTA tubes, and treated with either the spinning disk method or the two-spin centrifuge method. Three experimental groups, which combined different plasma extraction methods and blood collection tubes (BCT), were evaluated including: Spinning Disk + Streck (pink), Centrifuge + Streck (yellow), and Centrifuge + EDTA (blue). Gray-scale dots are shaded by donor (biological replicate) and represent three technical replicate measurements per donor (biological replicate). Significant differences in hemolysis between groups (t-test) are indicated. ** = p-value < 0.01. *** = p-value < 0.001. 1C. Plasma RNA Quantity in Spinning Disk- or Centrifuge-Processed Streck Samples. Average plasma RNA abundance quantified using qRT-PCR cycle threshold (Ct) values for the experimental groups (Spinning Disk + Streck, Centrifuge + Streck). Violin plots are colored by experimental group, with Spinning Disk + Streck in pink and Centrifuge + Streck in yellow. Gray-scale dots are shaded by donor (biological replicate) and represent three technical replicate measurements per donor (biological replicate). Significant differences in the distribution between groups are indicated (t-test). * = p-value < 0.05. ** = p-value < 0.01.

