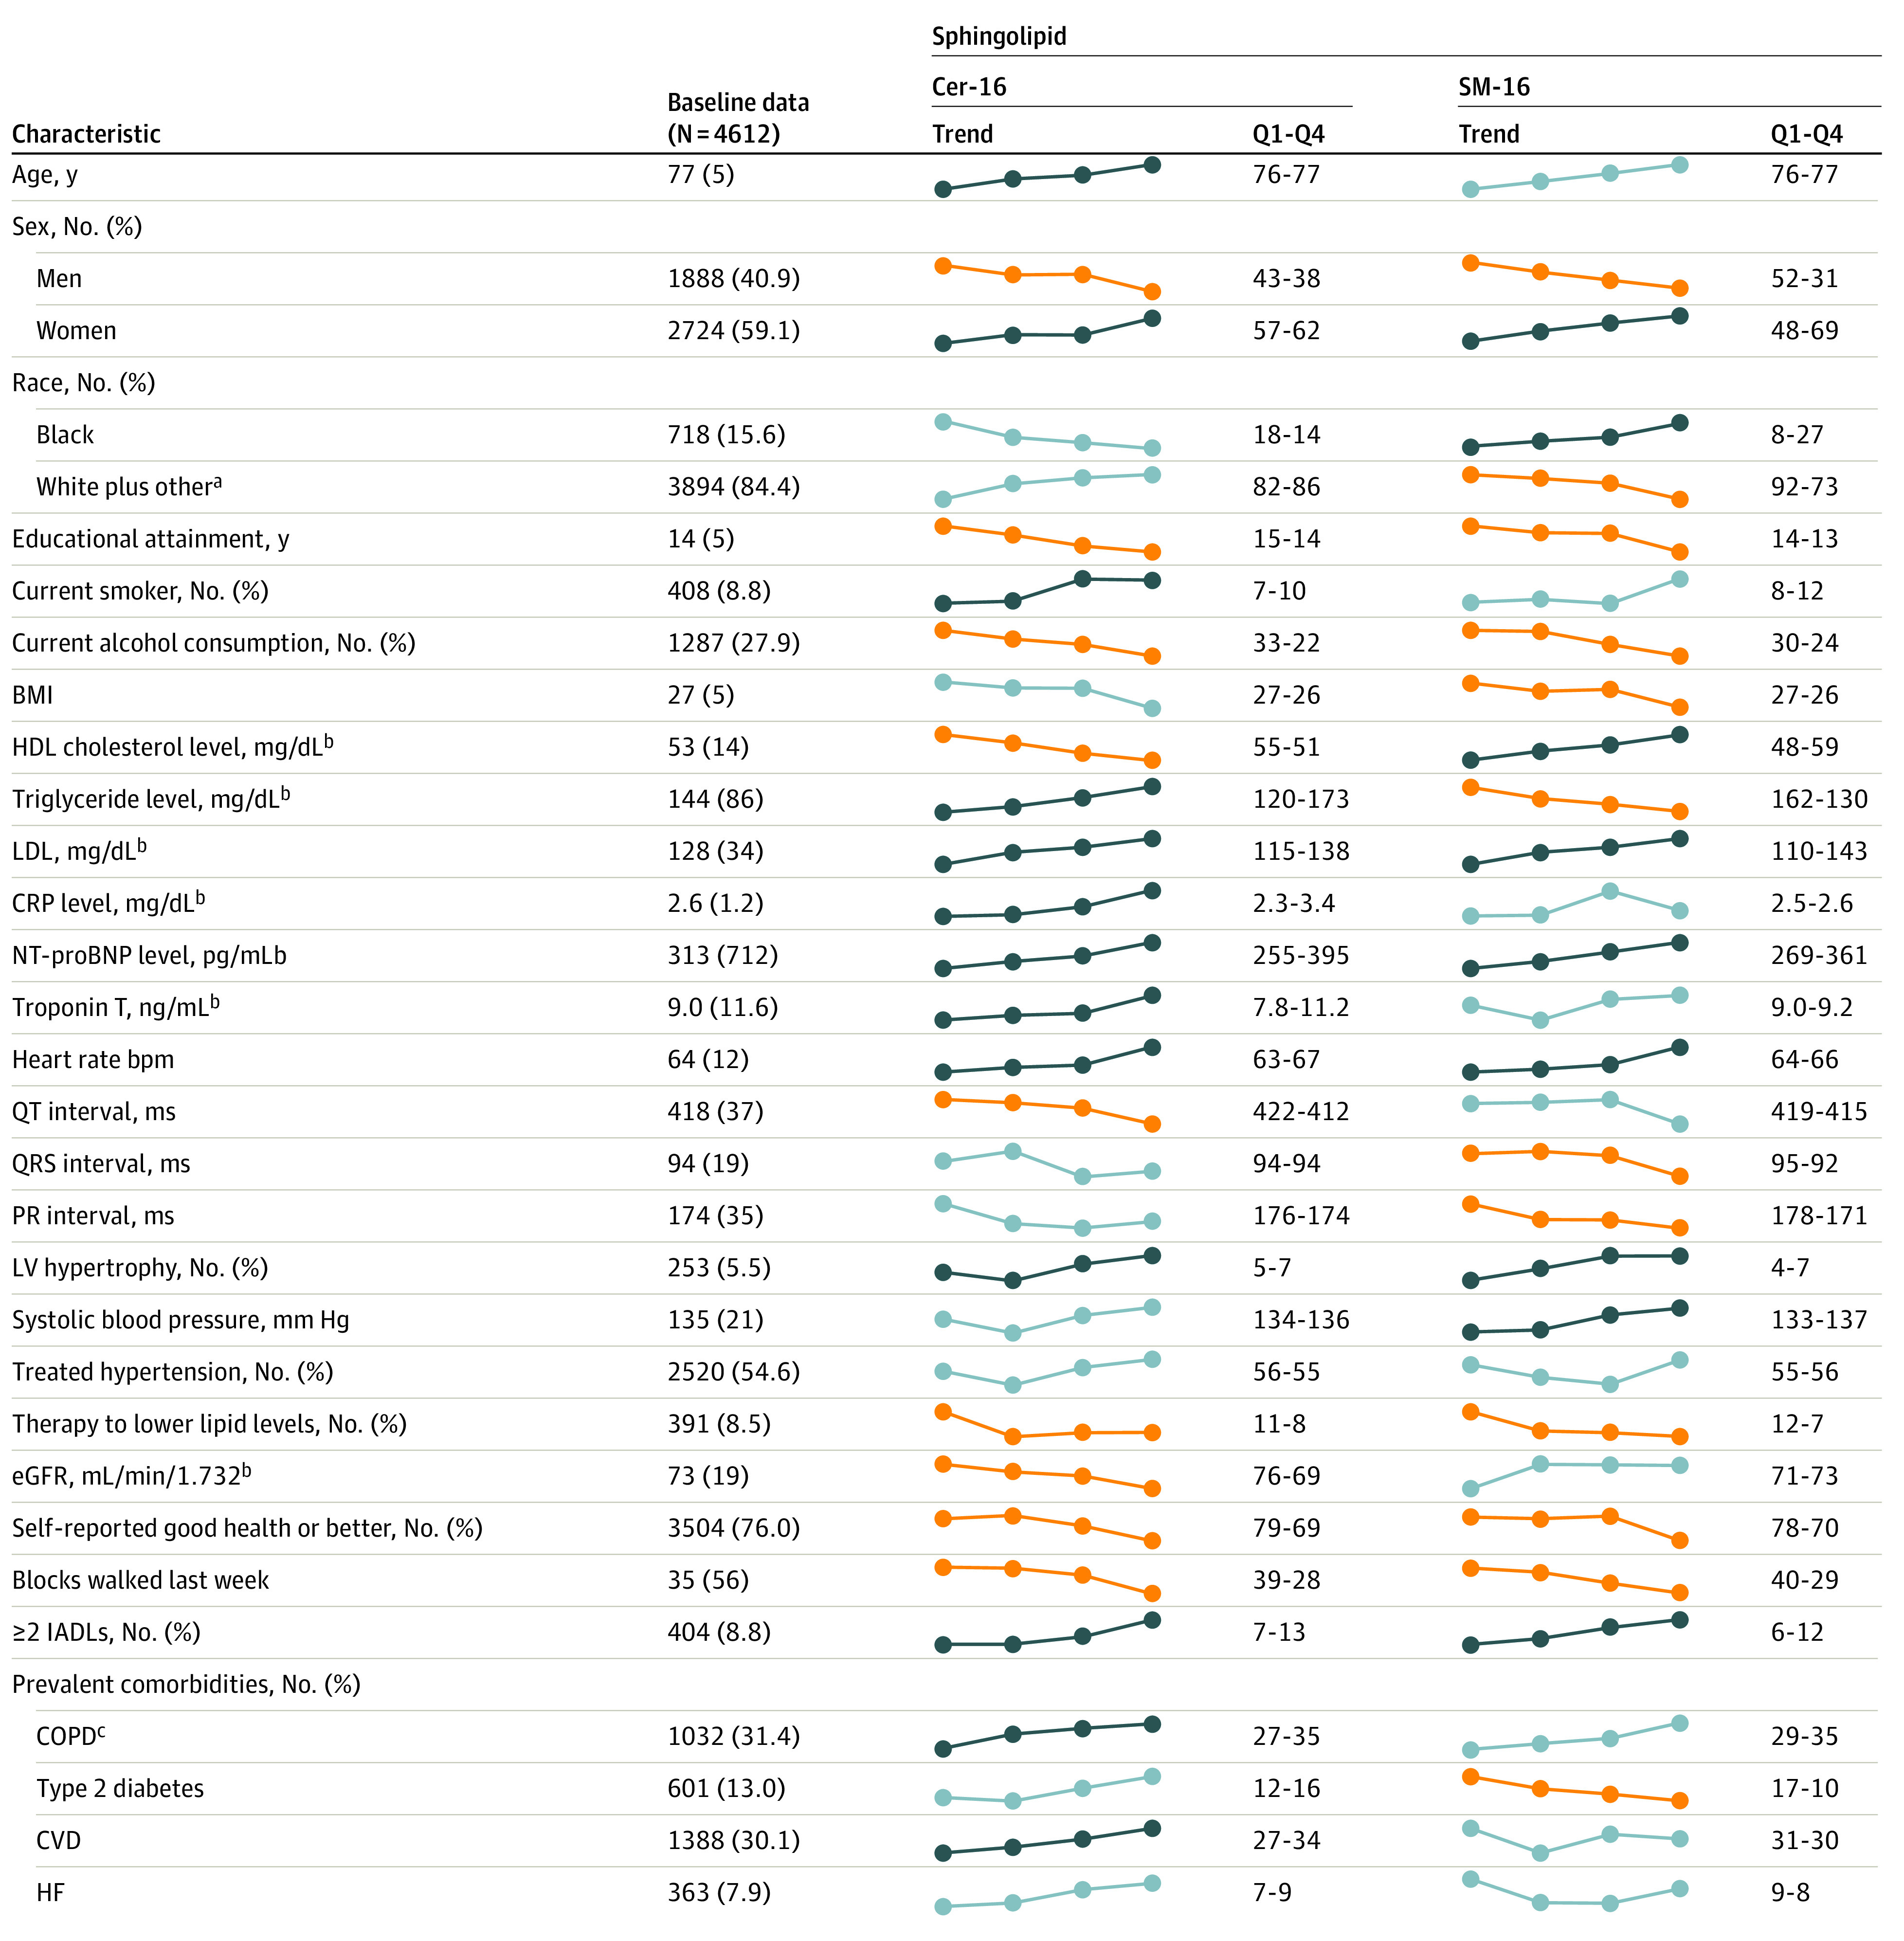
Figure 1. Baseline Characteristics and Trends Across Quartiles of Sphingolipid Levels Among Cardiovascular Health Study Participants.

Unless otherwise indicated, data are expressed as mean (SD). Unadjusted linear and logistic regression models were used to assess significant (P < .0018; 0.05/28 characteristics) associations of log-transformed sphingolipids with each characteristic. The dotted lines represent means or percentages of each characteristic across quartiles of each of the sphingolipids; dark blue lines indicate significant positive trends, orange lines indicate statistically significant negative trends, and light blue lines indicate P > .0018. Q1 indicates the mean or percentage of each characteristic among participants with a sphingolipid level in the lowest 25% of the distribution; Q4 indicates the mean or percentage among participants with a sphingolipid level in the highest 25% of the distribution. BMI indicates body mass index (calculated as weight in kilograms divided by height in meters squared); Cer-16, ceramide with palmitic acid; COPD, chronic obstructive pulmonary disease; CRP, C-reactive protein; CVD, cardiovascular disease; eGFR, estimated glomerular filtration rate; HDL, high-density lipoprotein; HF, heart failure; IADLs, instrumental activities of daily living; LDL, low-density lipoprotein; LV, left ventricle; NT-proBNP, N-terminal pro–brain-type natriuretic peptide; Q1, the lowest quartile of the distribution; Q4, highest quartile of the distribution; SM-16, sphingomyelin with palmitic acid. To convert CRP to mg/L, multiply by 10; HDL and LDL cholesterol to mmol/L, multiply by 0.0259; NT-proBNP to ng/L, multiply by 1.0; triglycerides to mmol/L, multiply by 0.0113; troponin T to μg/L, multiply by 1.0.
aOther includes American Indian or Alaska Native, Asian, and other.
bMeasured in 1992 to 1993 for all participants.
cInformation available for 3282 participants.
