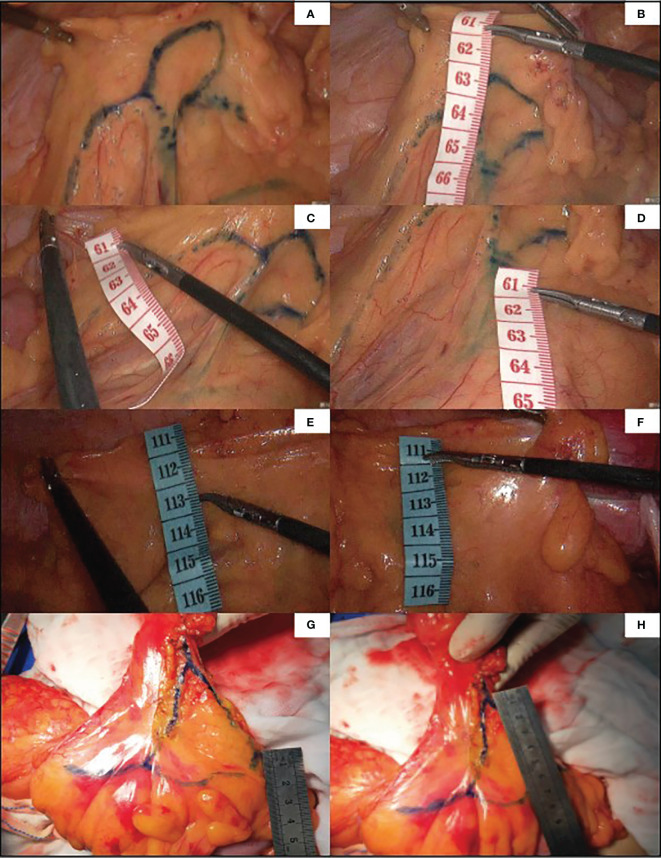
Figure 5.
Guided by ICG, the marginal vascular network was outlined with methylene blue dye (A) and the distance from the marginal artery to the intestinal wall was measured. (B) is the distance between primary arch and intestinal wall, (C) is the level of IMA root, (D) is the distance between secondary arch and intestinal wall. (E, F) demonstrate the difficulty of imaging marginal vessels in patients with mesenteric hypertrophy.In vitro measurement of ICG angiography in patients with mesenteric hypertrophy (G, H).

