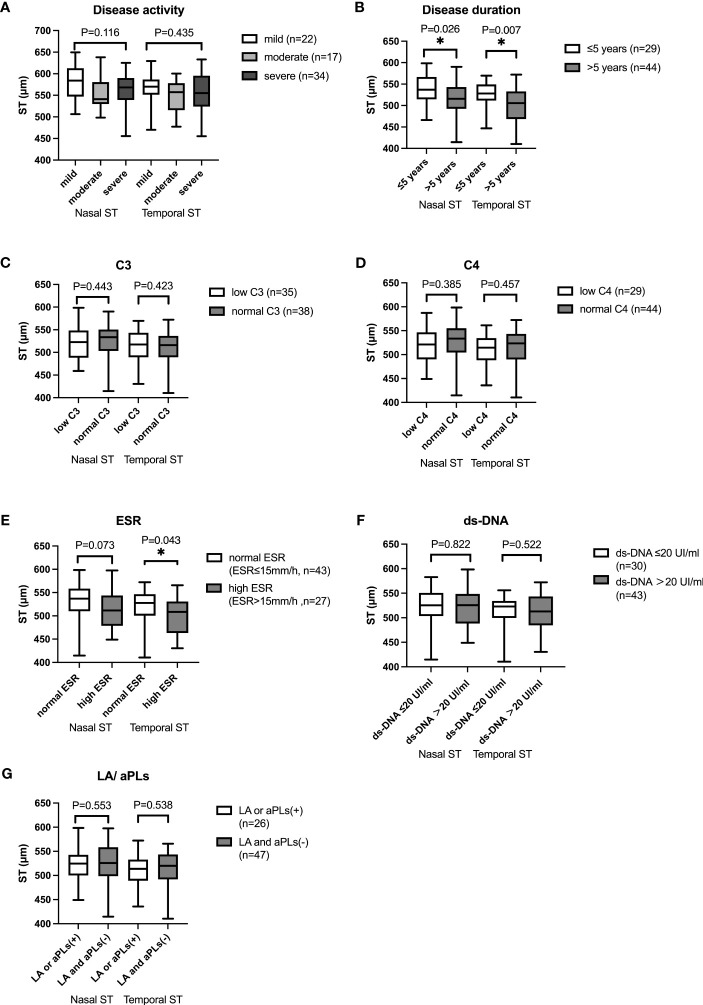
Figure 3.
Box-and-whisker plot showing mean nasal and temporal scleral thickness in SLE patients with different subgroups. (A) Mean nasal and temporal scleral thickness in SLE patients with different disease activity. (B) Mean nasal and temporal scleral thickness in SLE patients with different disease duration. Mean nasal and temporal ST were thicker in SLE patients with disease duration ≤5 years than those in patients with disease duration of longer than 5 years (p<0.05). (C) Mean nasal and temporal scleral thickness in SLE patients with different C3 level. (D) Mean nasal and temporal scleral thickness in SLE patients with different C4 level. (E) Mean nasal and temporal scleral thickness in SLE patients with different ESR. Mean temporal ST was higher in SLE patients with normal ESR than that in patients with higher ESR (p<0.05). (F) Mean nasal and temporal scleral thickness in SLE patients with different ds-DNA. (G) Mean nasal and temporal scleral thickness in SLE patients with different LA/aPLs. The boxes represent medians and interquartile ranges, with the lines in the middle of the boxes corresponding to the median values. * p<0.05.

