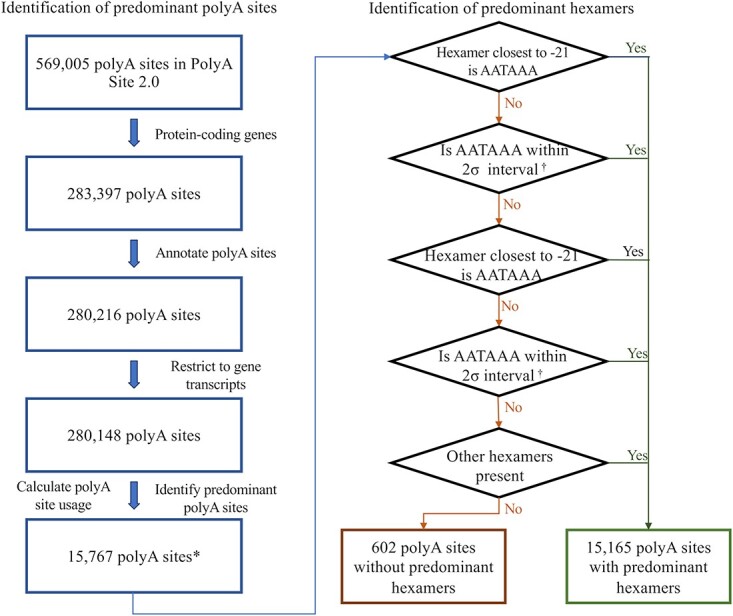
Figure 1.

The overview of the workflow to identify predominant polyA sites and predominant hexamers. * denotes the number of unique polyA sites, inclusive of polyA sites that may be shared by overlapping genes. The total number of genes is 16 004. † refers to 2 standard deviations from the mean of the distribution of corresponding lone hexamers downstream of polyA sites.
