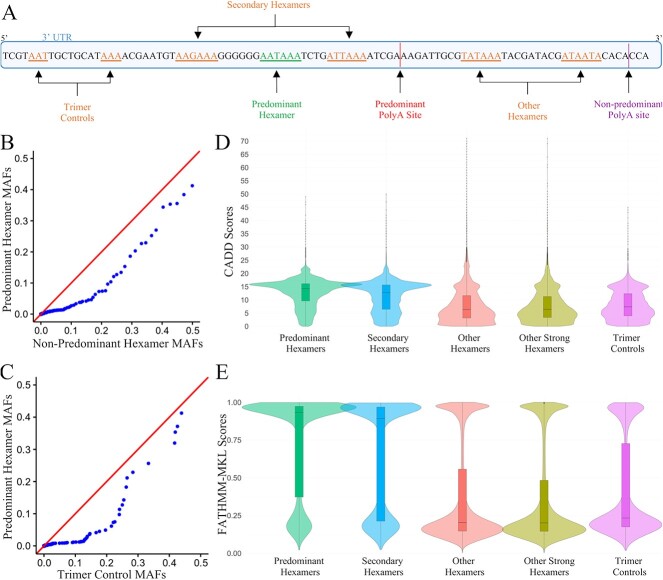
Figure 4.
Constraint analysis and in silico prediction of deleterious variants in predominant hexamers and controls. A: Diagram of predominant hexamers and control groups. B: Q-Q plot of the distribution of minor allele frequency (MAF) of variants observed in predominant hexamers compared to non-predominant hexamer regions (Secondary hexamers and Other hexamers). C: Q-Q plot of the distribution of MAF of variants observed in predominant hexamer regions compared to trimer controls. D, E: Comparison of CADD and FATHMM-MKL scores, respectively, between predominant hexamers, secondary hexamers, other hexamers, other strong hexamers, and trimer controls.

