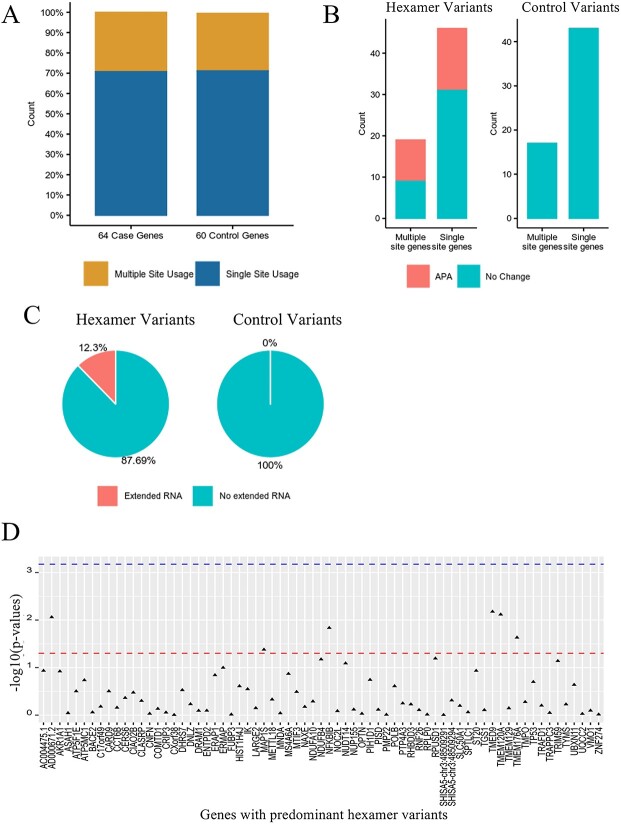
Figure 5.
Comparing the effect of variants in 3′ UTR regions. A: The proportion of genes with single polyA site usage vs. multiple polyA site usage for 64 case genes with hexamer variants and 60 control genes with control variants. B: The effect of predominant hexamer variants and control variants on alternative polyadenylation (APA). Multiple site genes refers to genes with multiple polyA sites, and single site genes refers to genes with one polyA site. C: The effect of predominant hexamer and control variants on mRNA. D: Gene expression analyses in 65 predominant hexamer variants. The lines from top to bottom denote Bonferroni corrected p-value and p-value = 0.05, respectively.

