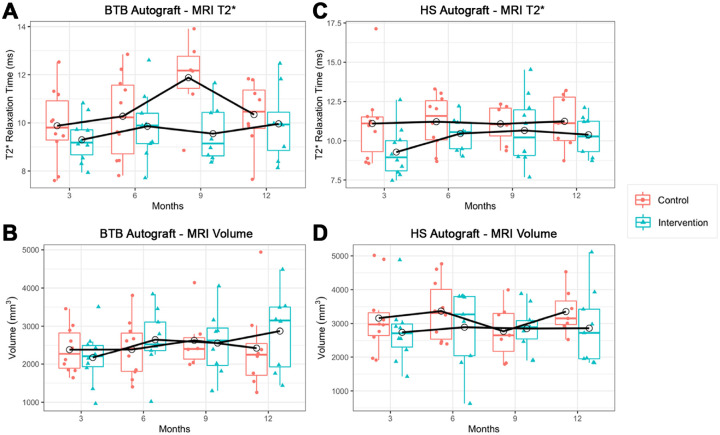
Figure 4.
(A) T2* relaxation time in the BTB and control groups. (B) Graft volume in the BTB and control groups. (C) T2* relaxation time in the HS and control groups. (D) Graft volume in the HS and control groups. Data points represented with empty circles indicate meanswith empty circles indicate means. The black solid line shows the mean profile. BTB, bone–patellar tendon–bone; HS, hamstring; MRI, magnetic resonance imaging.

