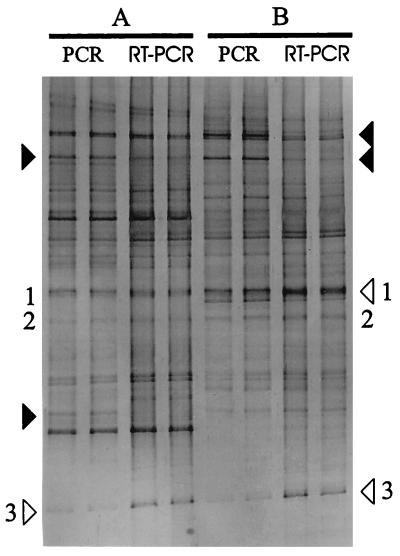
FIG. 3.
Comparison between TGGE patterns of PCR and RT-PCR products of the V6 to V8 regions from simultaneous rRNA and DNA isolations of fecal samples from individuals A and B (two replicates each). Solid arrowheads indicate bands with higher intensities in DNA- than in RNA-derived patterns. Open arrowheads indicate bands of higher intensities in RNA- than in DNA-derived patterns. Numbers 1 to 3 represent dominant bands found in all TGGE profiles.

