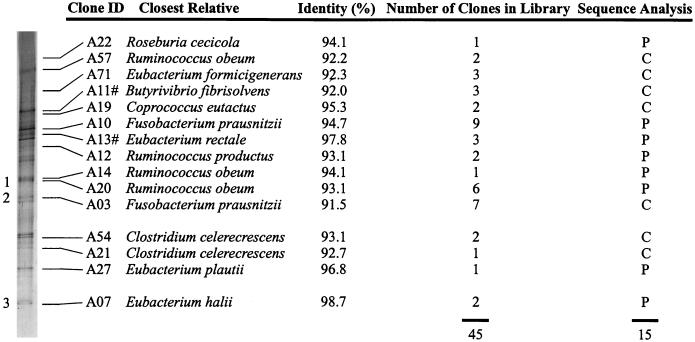
FIG. 6.
Identification of dominant bands in the RT-PCR pattern of the V6 to V8 regions of fecal samples from individual A. Listed are the closest relatives of the clones corresponding to the bands, their percent identity, the number of corresponding clones, and the sequence analysis. #, the V1 to V3 regions of two clones with identical mobility have been sequenced. P, partial 16S rDNA sequence; C, complete sequence. Amplicons encoded with 1, 2, and 3 were found in the TGGE patterns of all subjects.

