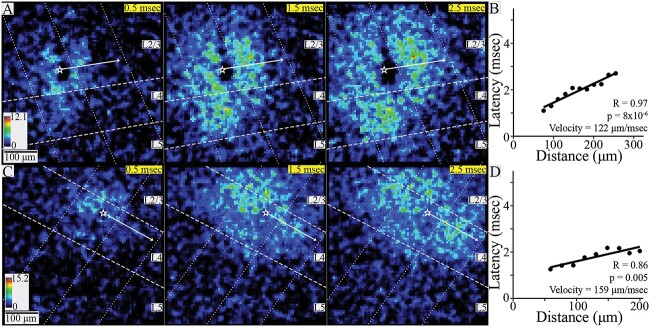
Fig. 5.
Intralaminar conduction. (A) SNR heatmaps at 1-ms intervals showing the spread of PV interneuron responses within L2/3 to stimulation in that layer. Responses spread within the stimulated column and to a neighboring column. (B) Latency versus distance for the slice shown in A (R = 0.97, P = 8 × 10⁻⁶) yielded a conduction velocity of 112 μm/ms. (C) SNR heatmaps at 1-ms intervals showing PV interneuron responses within L4 to stimulation in that layer. (D) Latency versus distance for the slice shown in C (R = 0.86, P = 0.005) yielded a conduction velocity of 159 μm/ms. In all heatmaps, white stars mark stimulation site and white arrows show PV interneuron response propagation trajectories; dashed lines show layer boundaries, and dotted lines show column boundaries. Time after stimulation shown in upper right corner of each heatmap on yellow background.

