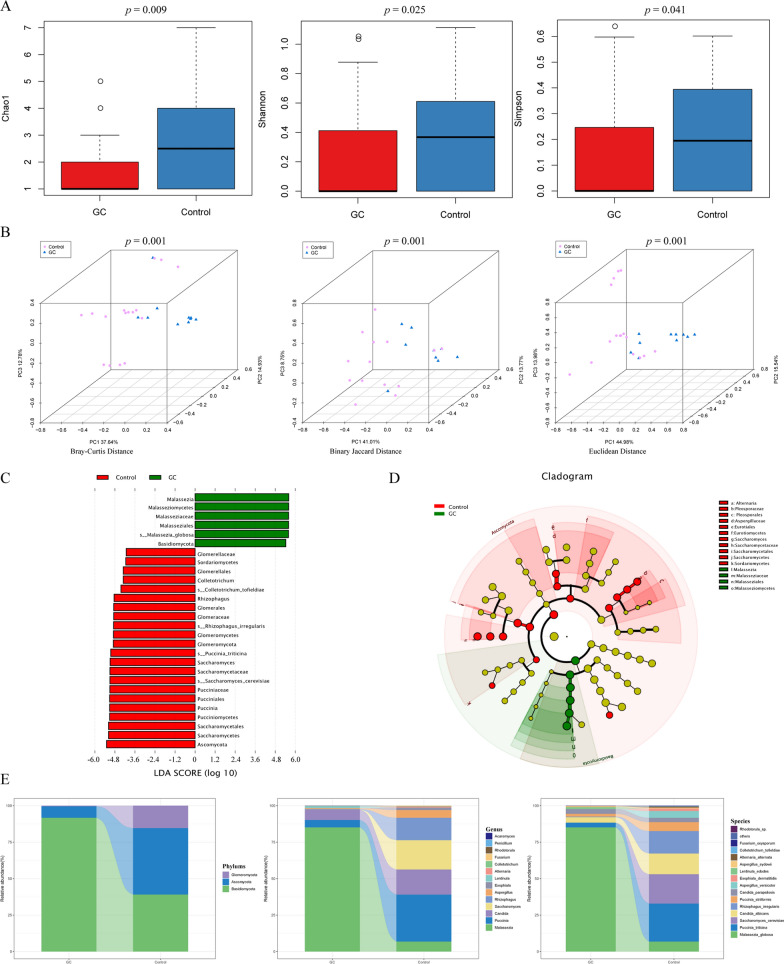
Fig. 2.
Salivary fungal diversity, abundance, and distribution in the two groups. A Comparison of salivary fungal alpha diversity between the two groups based on Chao1, Shannon index, and Simpson index. B Comparison of salivary fungal beta diversity (Bray–Curtis distance, binary Jaccard distance and Euclidean distance) between the two groups. C, D The LEfSe results identified the most divergent fungal taxa in the two groups and scored the two groups of saliva samples by LDA. The brightness of each point was proportional to the size of its effect. E The relative abundance of the salivary fungal phyla, the top 15 most abundant genera, and species is represented in the bar plot

