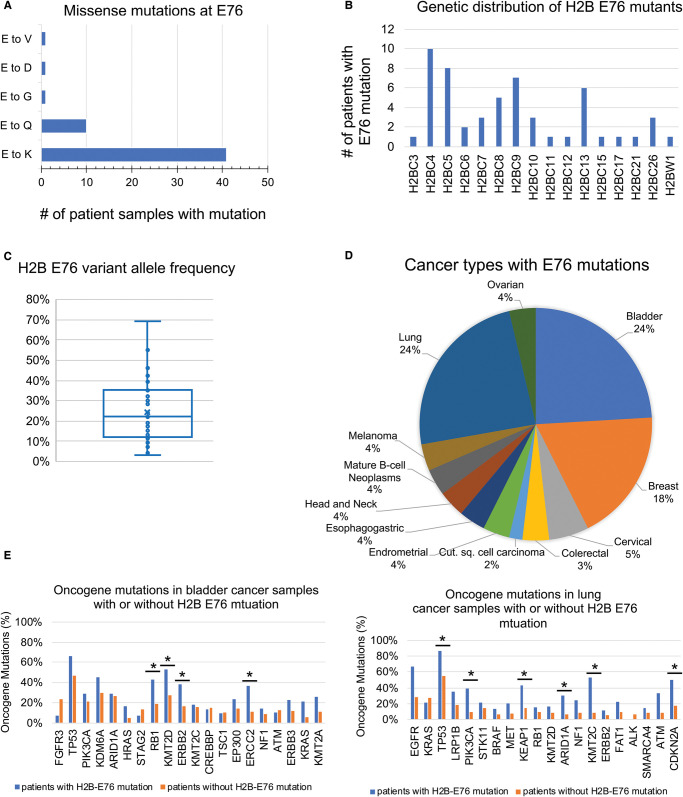
Figure 3. Analysis of H2B E76 mutations in cancer.
(A) Distribution of missense mutations at H2B amino acid E76. (B) Frequency of mutation at E76 across H2B genes. (C) H2B E76 variant allele frequency in all cancer types. (D) Distribution of cancer types with H2B E76 mutations. (E) The frequency of genomic alterations in the indicated oncogene was compared in profiled patient samples with (blue bar) or without (orange bar) H2B missense mutations at E76. Oncogene alterations that significantly co-occur with H2B E76 mutations (P < 0.5 and Q < 0.5) are indicated by a *.

