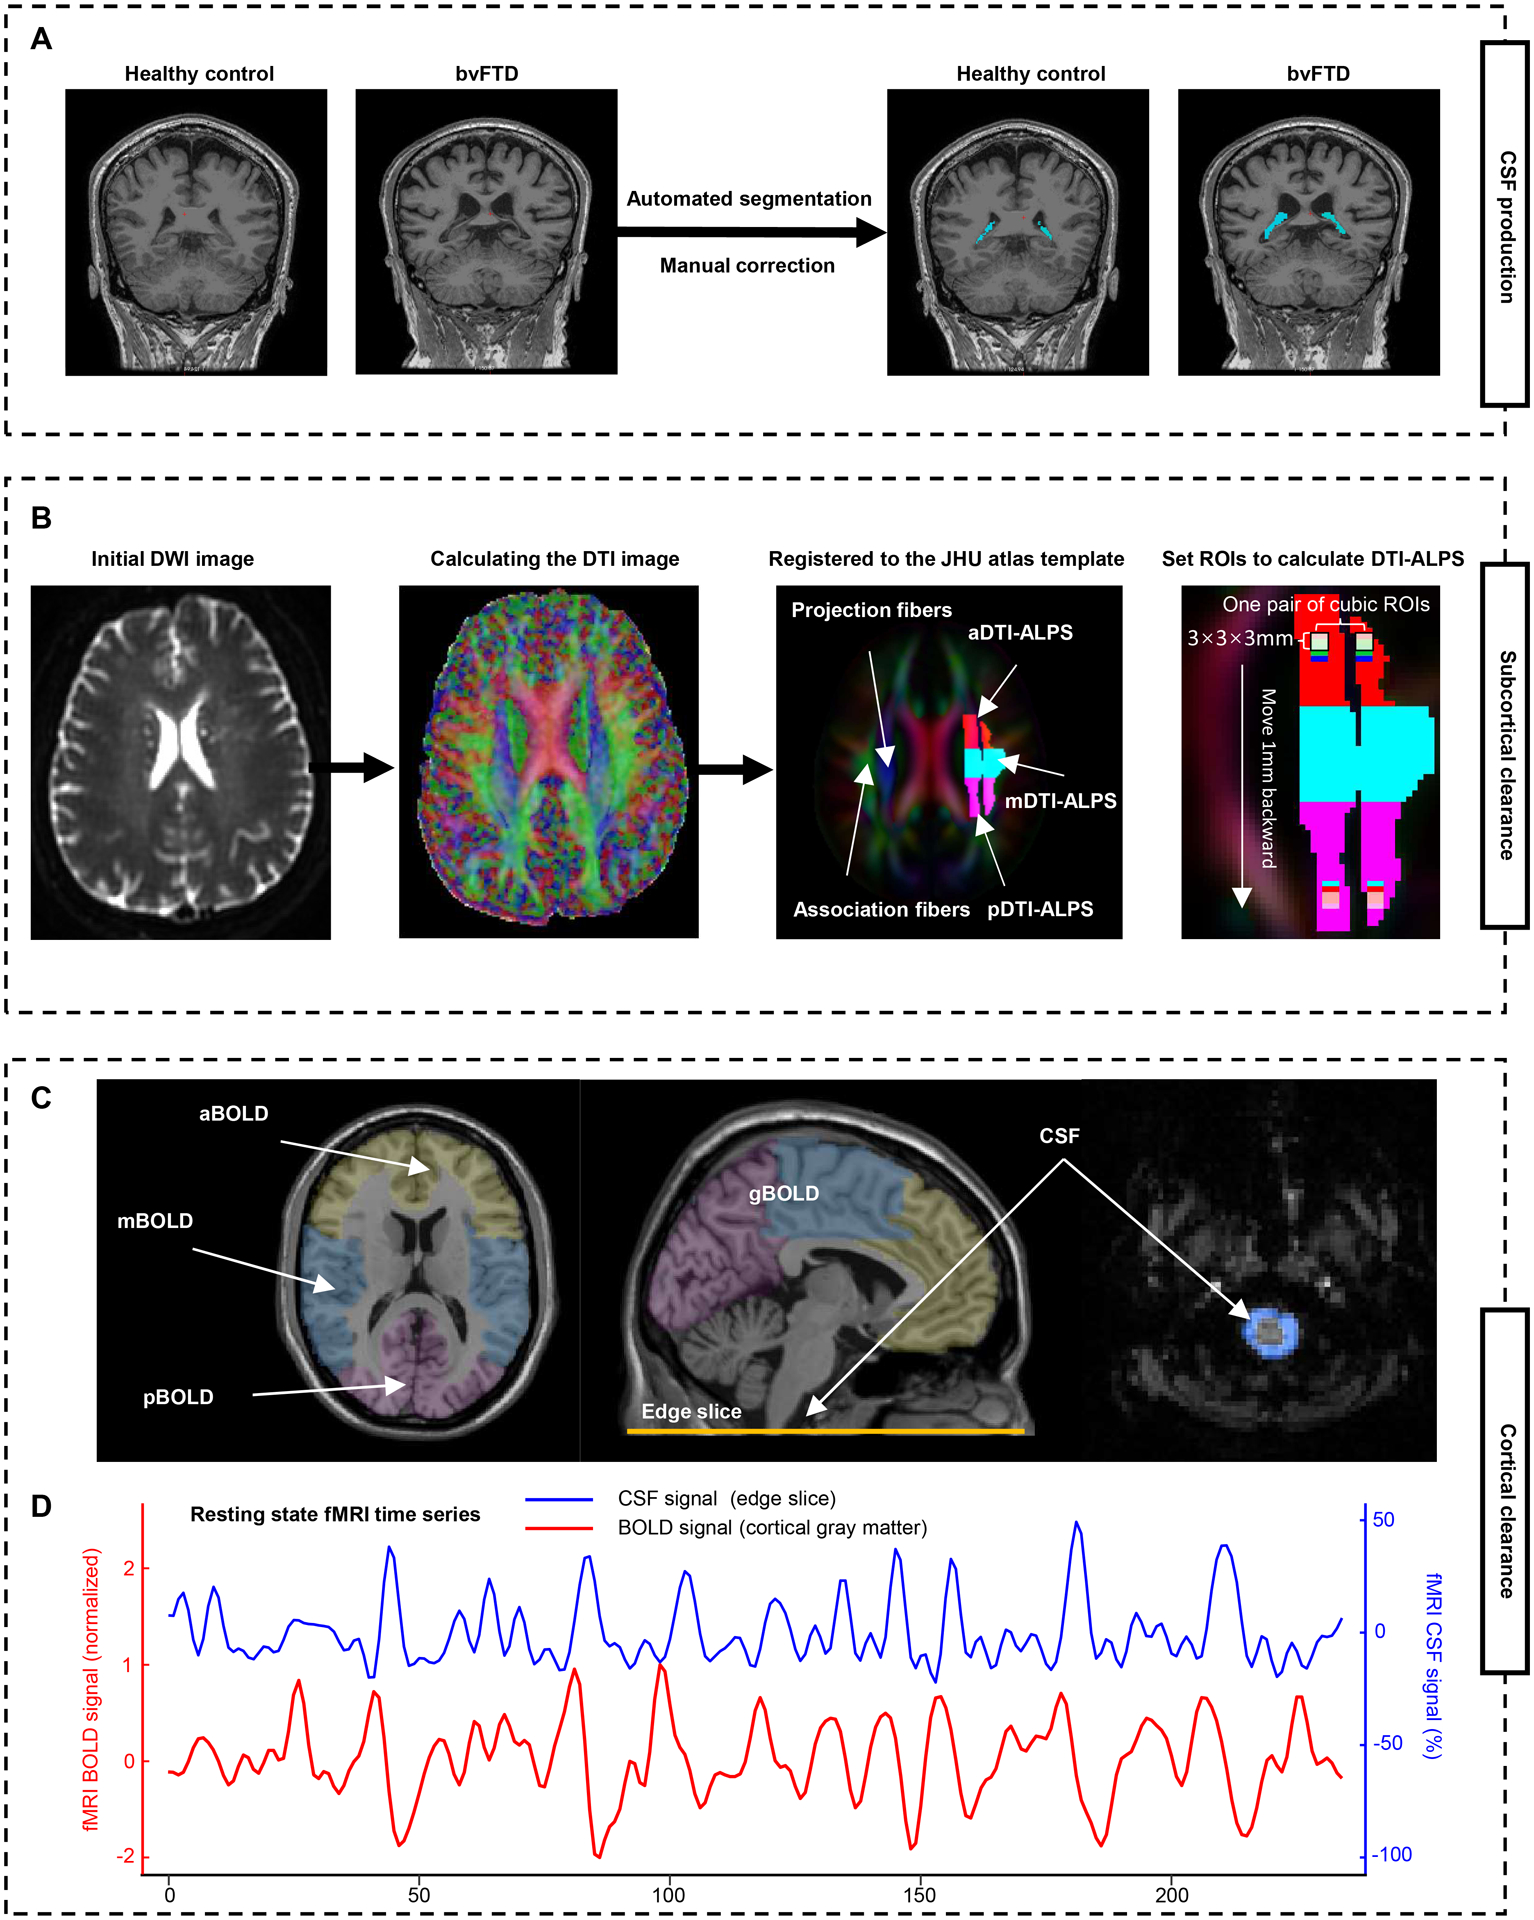
Figure 2: Schematic of the multi-parametric assessment approaches for the glymphatic function.

(A) Automated segmentation and manual correction of choroid plexus within the lateral ventricles. (B) MRI processing approach for DTI-ALPS calculation and segmentation. Initial DWI image is coregistered to the corresponding T1-weighted image, and then calculated the DTI image. The FA map is registered to the FA map of the JHU atlas template. The ROIs were extracted and segmented into three parts based on the atlas labels (anterior, superior, and posterior corona radiata, and superior longitudinal fasciculus). Additionally, 46 parts of 3 × 3 × 3 mm3 cubic ROIs are drawn in the left projection and association fibers. (C) To calculate the BOLD-CSF coupling, the global BOLD signal is extracted from the cortical gray matter region of cerebrum, then is divide into three parts: anterior BOLD, middle BOLD, and posterior BOLD. The CSF signals are extracted from the edge slice of fMRI acquisition located between the upper spinal cord/medulla oblongata and lower cerebellum. (D) A strong coupling between the global cortical BOLD signals and CSF signals was observed in a representative healthy control. a/m/pDTI-ALPS = anterior/middle/posterior diffusion along perivascular space index; g/a/m/pBOLD-CSF coupling = the coupling between blood-oxygen-level-dependent signals from global/anterior/middle/posterior cortical gray matter and cerebrospinal fluid signals; FA = fractional anisotropy; ROIs = regions of interests; JHU atlas = Johns Hopkins University atlas.
