
Figure 3: The cross-correlation analysis between the BOLD signal and the CSF signal.
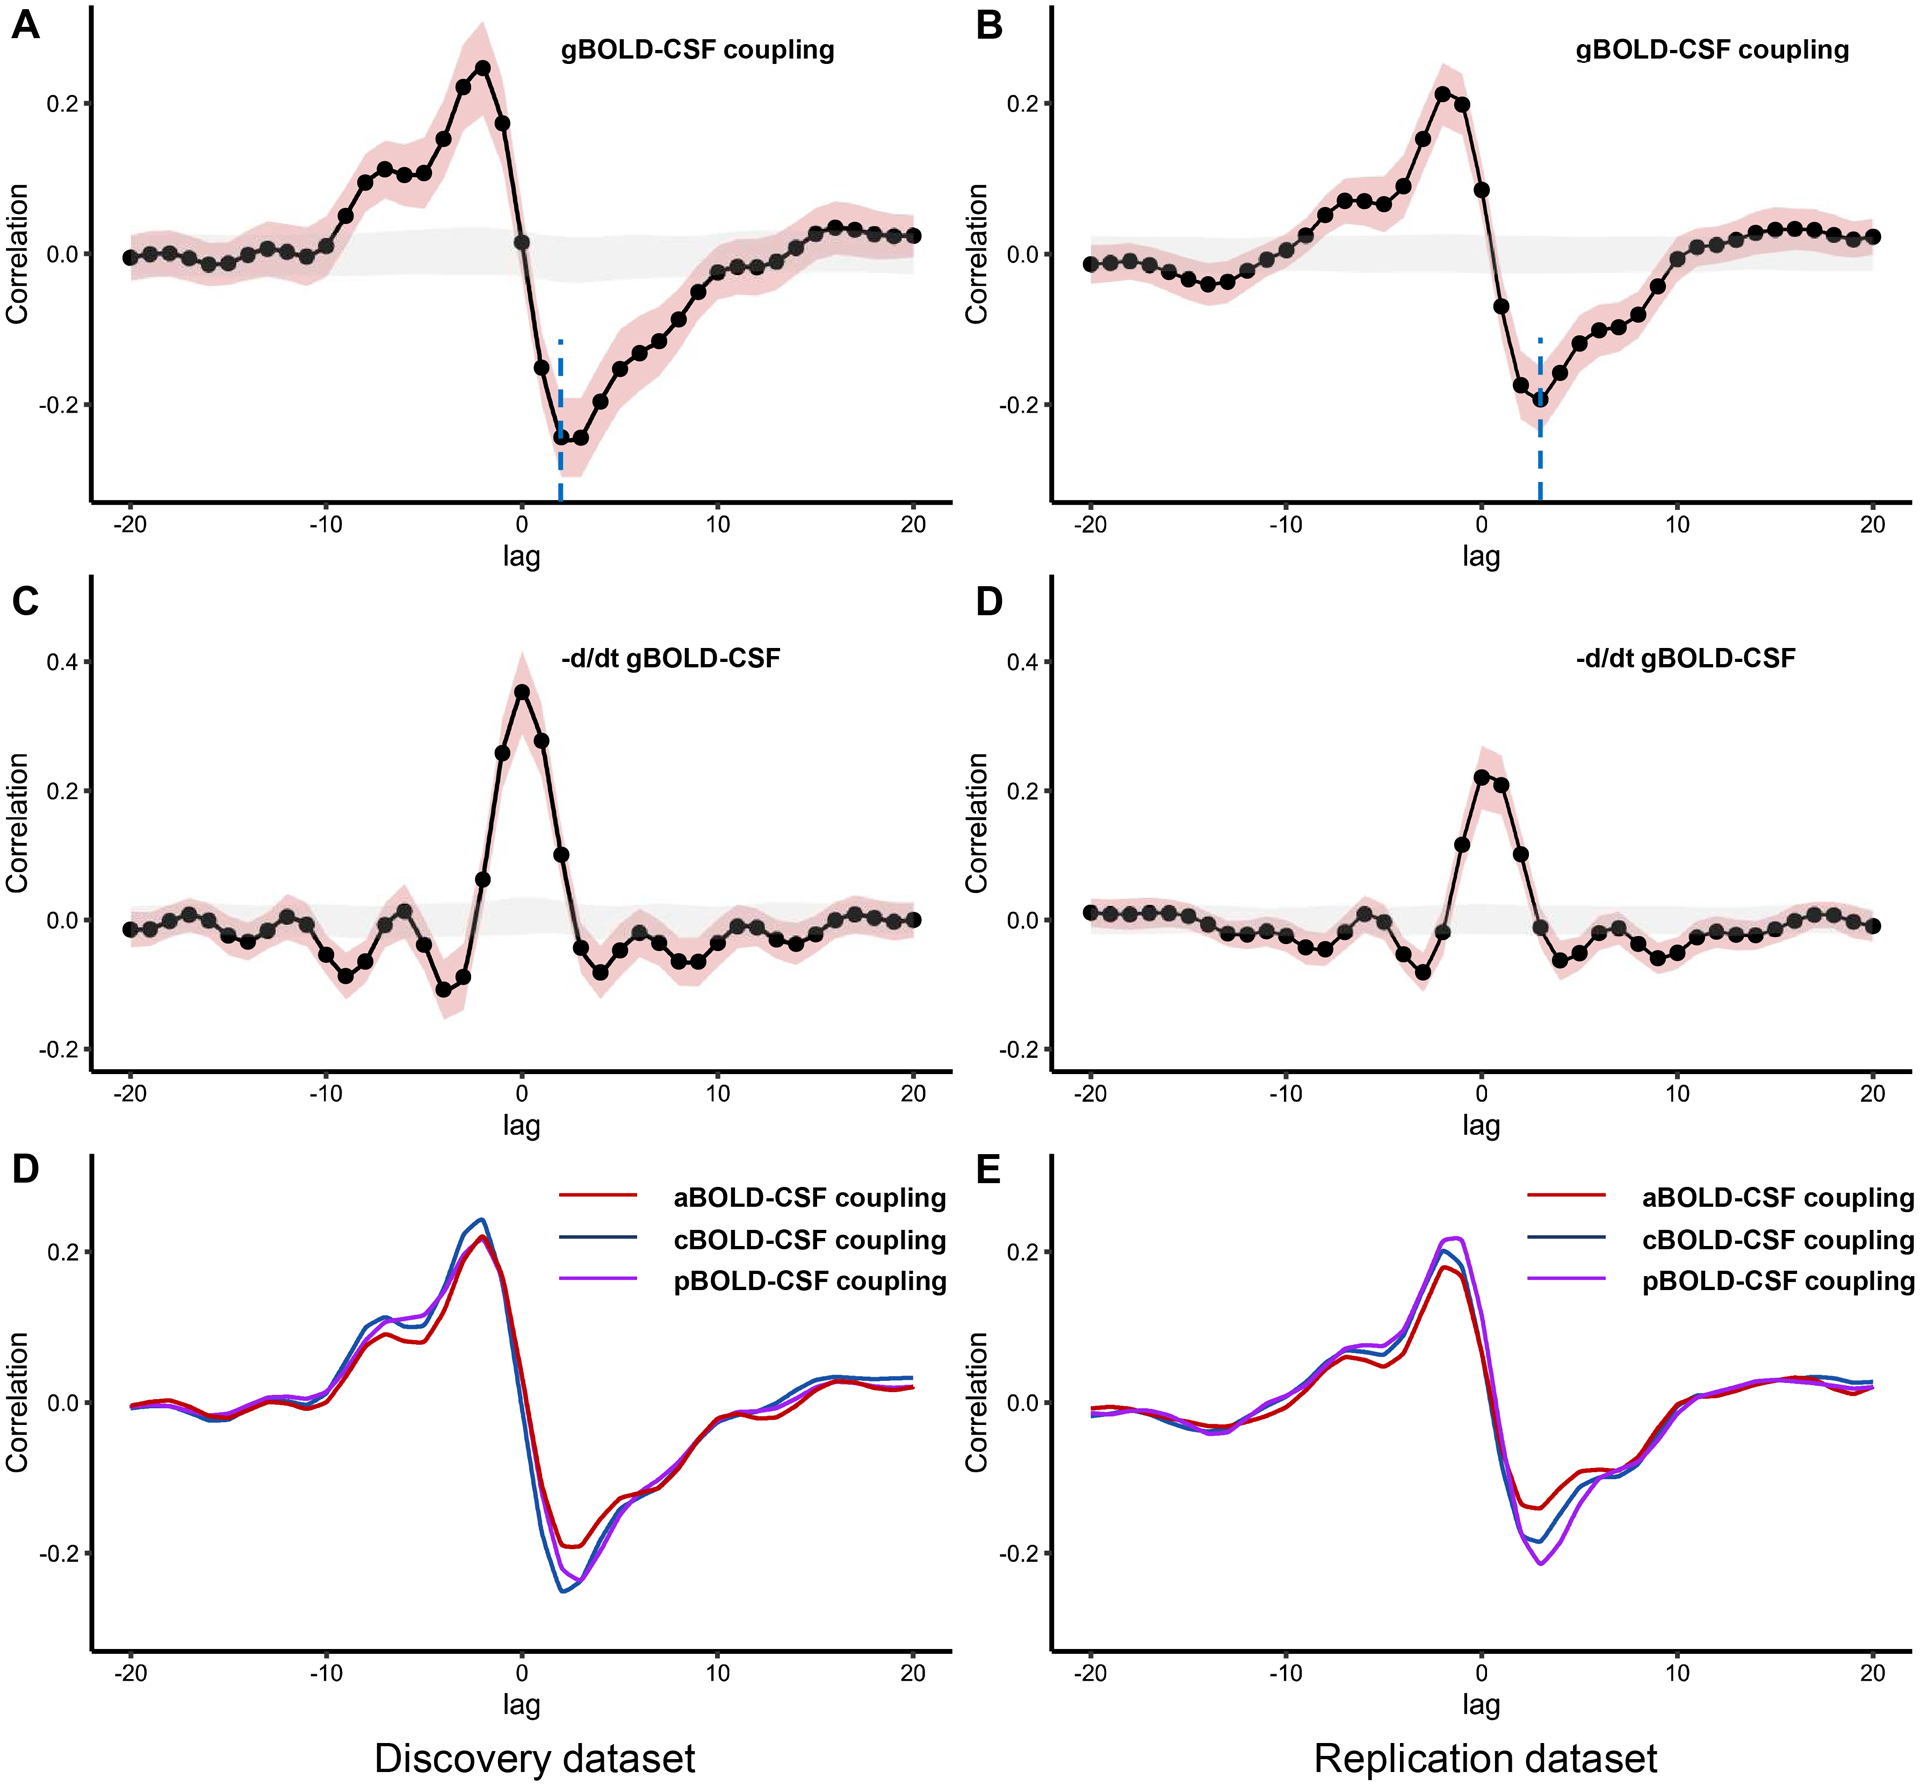
(A-B) The mean gBOLD-CSF cross-correlation function (−20~+20s) displays positive peaks at time lags −2~−3 s (r = 0.21–0.24, P < 0.001, permutation test) and a negative peak at time lags 2~3 s (r = −0.19–−0.24, P < 0.001, permutation test; blue dotted line). (C-D) The mean negative first-order derivative gBOLD signals couple with CSF signals. Large positive peaks are seen at time lags 0s (r = 0.22–0.35, P < 0.001, permutation test). (E-F) Anterior, middle, and posterior BOLD-CSF coupling show different coupling strength at negative peaks. Shaded red is 95% interval of the mean correlation coefficient across subjects. Shaded grey is 95% interval of mean correlation coefficient across random pairs 1000 times repeatedly. g/a/m/pBOLD-CSF coupling = the coupling between blood-oxygen-level-dependent signals from global/anterior/middle/posterior cortical gray matter and cerebrospinal fluid signals.