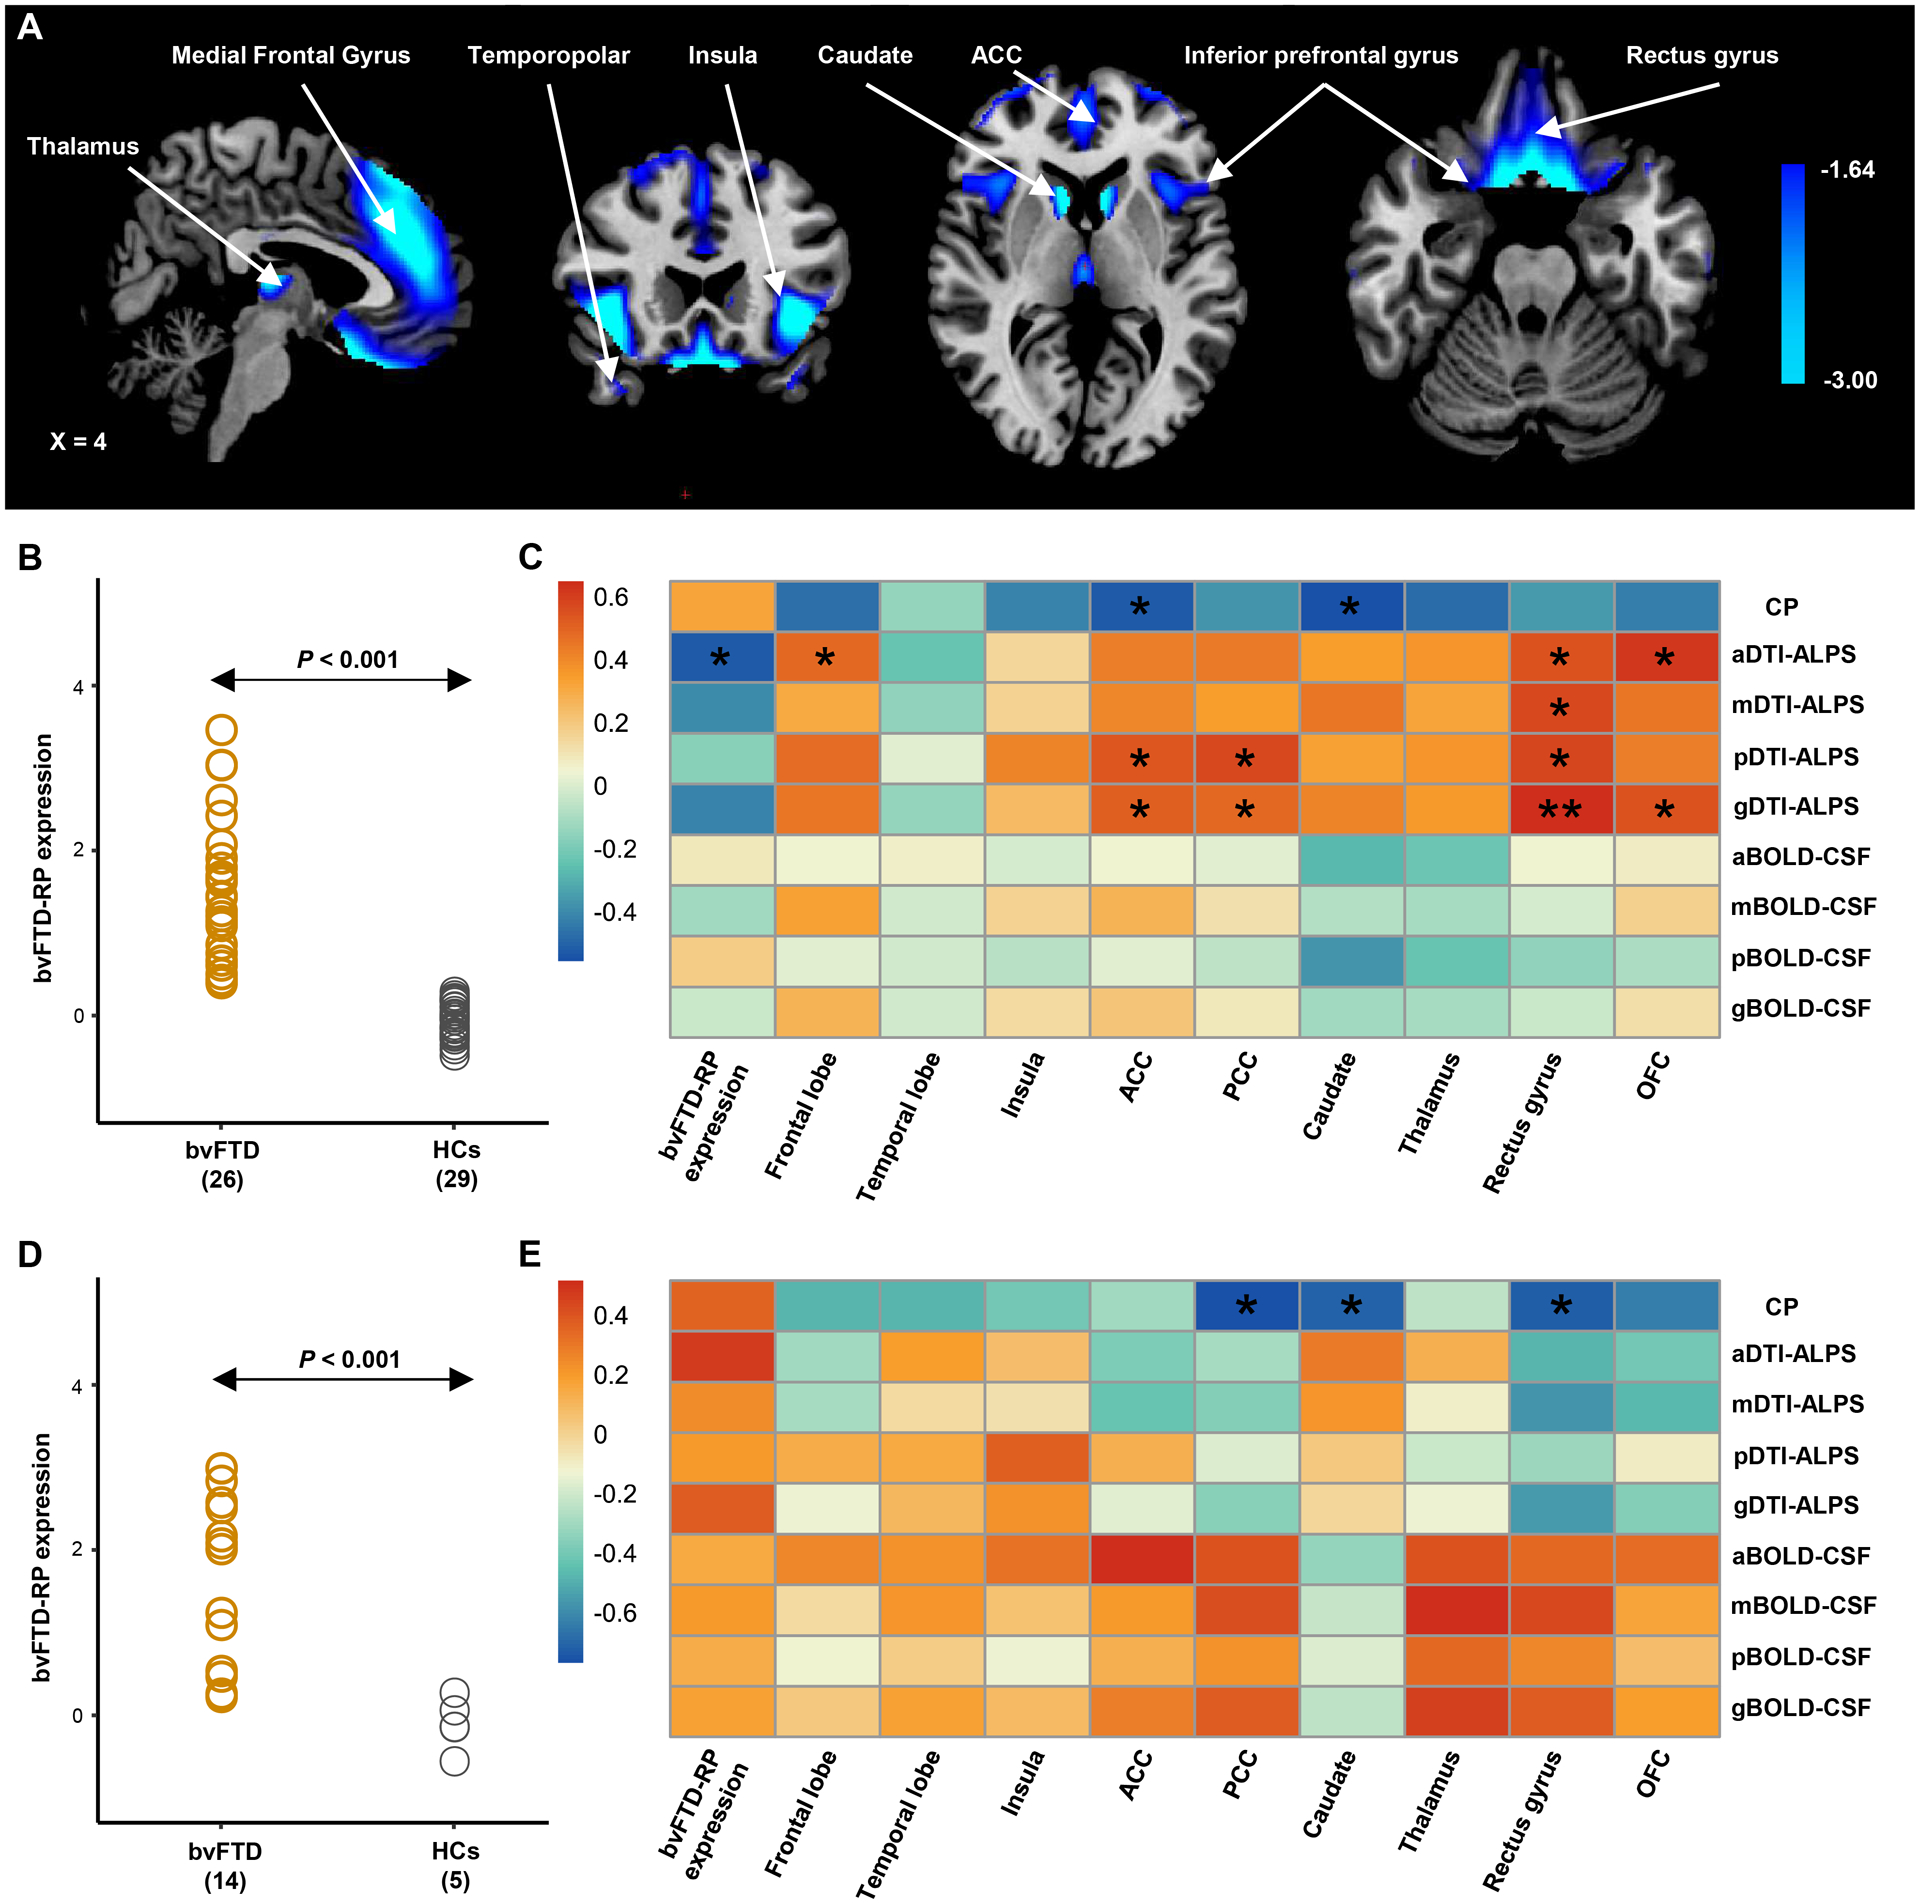
Figure 4: Behavioral variant frontotemporal dementia-related pattern (bvFTD-RP) and the spatial correlation with the glymphatic function.

(A) The bvFTD-RP was identified from the 18F-FDG PET data of 26 patients with bvFTD and 29 age- and sex-matched healthy controls from the discovery dataset using the spatial covariance analysis (SSM/PCA). Voxel weights on metabolic network regions reliable based on bootstrap estimation. Metabolic reductions were observed in bilateral metabolic reductions in the thalamus, caudate, insular, ACC, OFC, rectus gyrus, inferior and middle frontal gyrus, and temporopolar. (B) Individual bvFTD-RP expression significantly (P < 0.001, Student’s t test between groups) separated the bvFTD patients from the healthy controls from the discovery dataset, and this finding was validated in the replication dataset (D). (C-E) Heatmap shows the partial correlation analysis between glymphatic measures and the bvFTD-RP expression and the regional SUVRs value of nine ROIs in bvFTD patients from the discovery dataset (C) and replication dataset (E). P values were adjusted for age, sex and frontotemporal volume, and corrected for multiple comparisons using the false discovery rate approach. g/a/m/pDTI-ALPS = global/anterior/middle/posterior diffusion along perivascular space index; g/a/m/pBOLD-CSF coupling = the coupling between blood-oxygen-level-dependent signals from global/anterior/middle/posterior cortical gray matter and cerebrospinal fluid signals; SUVRs= standardized uptake value ratios; ACC = anterior cingulate gyri; PCC = posterior cingulate gyri; OFC = orbitofrontal cortex; bvFTD = behavioral variant frontotemporal dementia; HCs = healthy controls. *P < 0.05, **P < 0.01.
